Bringing a process under control
Process control charts identify special-causes of variation that need to eliminated to bring the process under control, so the results are predictable and can be used to determine the ability of a process to meet customer specifications.
During the installation period of a new automated colorimeter for controlling the copper content in the plating process control charts can be used to identify special-causes of variation that need to eliminated to make the process perform predictably. The Xbar and R charts plot the mean and range of the copper concentration in the plating pool respectively.
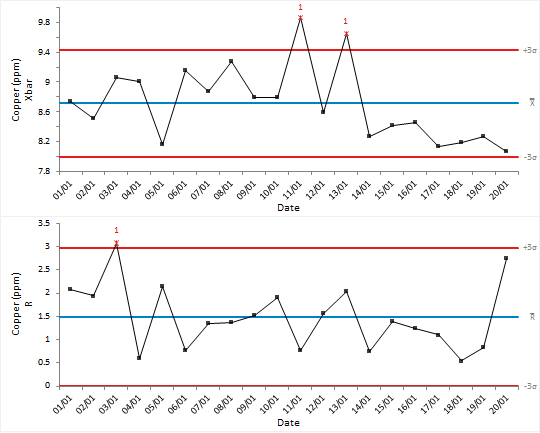
Inspecting the plots you can see special-cause variation is present in the
process:
- There is a point dated the 03/01 on the R chart with high variation.
- There are 2 further points dated the 11/01 and 13/02 on the Xbar chart.
Next topic: Identifying stratification