Statistics add-in software for statistical analysis in Excel
  • Tutorials
  • Process control charts tutorial

Monitoring future production

Once a reliable set of control limits are determined they can be used to monitor future production.

  1. On the Analyse-it ribbon tab, in the Report group, click Goto dataset.
  2. On the Analyse-it ribbon tab, in the Dataset group, click Filter.

    The filter is removed from the dataset and the additional data after the improvements were implemented is shown.

  3. On the Analyse-it ribbon tab, click Return to analysis.
  4. Select the Known process parameters check box.
  5. Select the Vary for each process change option.
  6. In the Parameters grid, alongside the Production phase, in the Mean edit box, type 8.647, and in the SD edit box, type 0.429.
  7. Clear the Advanced out-of-control rules check box.
  8. On the Analyse-it ribbon tab, in the Process Control group, click EWMA.
    In the analysis task pane, a new panel Control Chart (Moving Average) is added.
  9. Click Recalculate.

Control limits for the production phase are computed based on the process mean and standard deviation computed during the OQ stage.

Xbar-R control chart with process phases

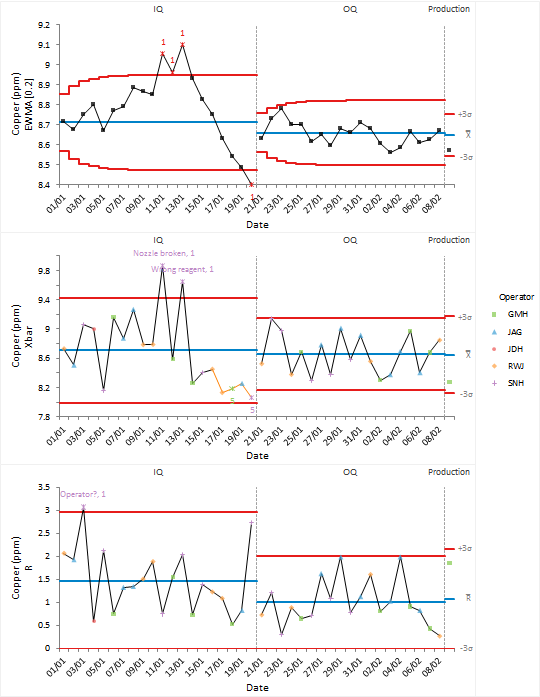
The EWMA control chart is more sensitive to detecting small shifts in the process mean than the Shewhart control chart and is an alternative to the advanced control rules. Small drifts in the process mean may indicate a drift in the calibration of the automated colorimeter that is used to control the amount of copper in the plating pool.

  •  Tutorials
  •  Distribution tutorial
  •  Correlation / PCA tutorial
  •  Compare groups means tutorial
  •  Association in 2-way contingency tables tutorial
  •  Simple linear regression tutorial
  •  Bland-Altman method comparison tutorial
  •  Estimating the precision of a measurement procedure (CLSI EP05-A3)
  •  Evaluating the linearity of a measurement procedure (CLSI EP06-A)
  •  Verifying the precision of a measurement procedure against a performance claim and estimating the bias (CLSI EP15-A3)
  •  Pareto charts tutorial
  •  Process control charts tutorial
  •  Bringing a process under control
  •  Identifying stratification
  •  Identifying special-causes of variation
  •  Identifying shifts (and other patterns)
  •  Revising control limits
  •  Monitoring future production
  •  Process capability tutorial


Version 6.15
Published 18-Apr-2023
statistics software, statistical software for Excel
  • Products
  • Store 
  • Support
  • Blog
  • About us
  • Download trial
  •  Search
  •  Sign in
  •  Contact us
Analyse-it editions
  • Standard edition
  • Medical edition
  • Method Validation edition
  • Quality Control & Improvement edition
  • Ultimate edition

  • Blog  
  • About us
  • Contact us  
  • Privacy policy


Copyright 2026 Analyse-it Software, Ltd, Leeds, United Kingdom .
We use essential cookies to run the site, and optional analytics to improve the experience for visitors. For more information see our Privacy policy.