
Identifying stratification
When data are collected under a variety of different conditions the meaning of the data can be hard to see. Stratification within a process can lead to hidden underlying patterns.
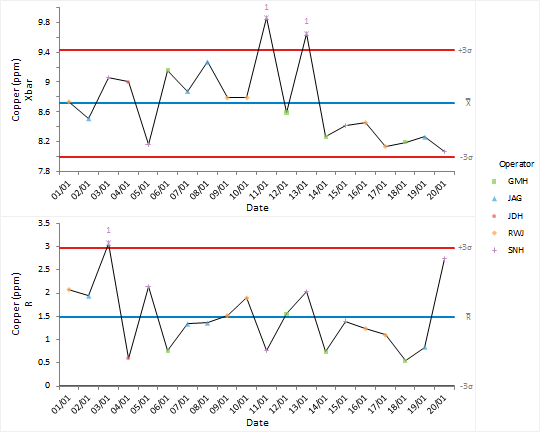
Control chart points are plotted using a symbol and color depending on the operator. It is easy to see that the operator SNH was responsible when the out-of-control signals occurred.
After investigating the causes of the out-of-control condition we document them in the worksheet alongside the data.
Next topic: Identifying special-causes of variation