Statistics add-in software for statistical analysis in Excel
  • Statistical Reference Guide
  • Control charts
  • Time-weighted control charts

CUmulative SUM (CUSUM) chart

A cumulative sum (CUSUM) chart is a type of control chart used to monitor small shifts in the process mean. It uses the cumulative sum of deviations from a target.

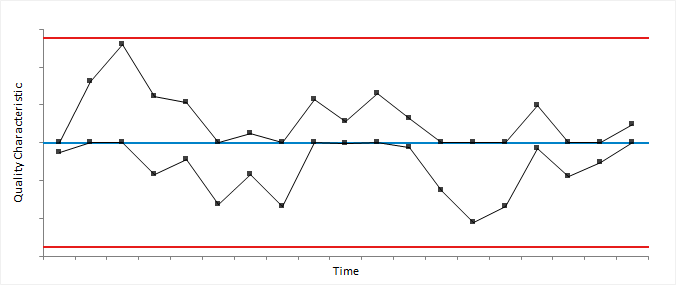
The CUSUM chart plots the cumulative sum of deviations from the target for individual measurements or subgroup means.


cusum plot

The CUSUM requires two parameters:
  • A reference value (k) specified in sigma units. k is often set to half the shift to be detected, in sigma units. Default k=0.5 which is equal to detecting a shift of 1 sigma.
  • The decision limit (h) specified in sigma units. Default h=5.
When designing a CUSUM chart it is necessary to consider the average run length and shift to be detected. Extensive guidance is available on suitable parameters (NIST 2012, Montgomery 2012).

It is possible to modify the CUSUM, so it responds more quickly to detect a process that is out-of-control at start-up. This modification is done using an initial CUSUM equal to half of the h parameter.

Like the EWMA, CUSUM is sensitive to small shifts in the process mean but does not match the ability of a Shewhart chart to detect larger shifts. For this reason, it is sometimes used together with a Shewhart chart (Montgomery 2012).

Related concepts
Exponentially Weighted Moving Average (EWMA) chart
Shewhart variables control charts
Related tasks
Creating a CUSUM control chart
Related information
N. I. S. T. (2012). e-Handbook of Statistical Methods.
Montgomery, D. C. (2012). Introduction to statistical quality control. John Wiley & Sons.
Available in Analyse-it Editions
Quality Control & Improvement edition
Ultimate edition

  •  What is Analyse-it?
  •  What's new?
  •  Administrator's Guide
  •  User's Guide
  •  Statistical Reference Guide
  •  Distribution
  •  Compare groups
  •  Compare pairs
  •  Contingency tables
  •  Correlation and association
  •  Principal component analysis (PCA)
  •  Factor analysis (FA)
  •  Item reliability
  •  Fit model
  •  Method comparison / Agreement
  •  Measurement systems analysis (MSA)
  •  Reference interval
  •  Diagnostic performance
  •  Survival/Reliability
  •  Control charts
  •  Shewhart control charts
  •  Time-weighted control charts
  •  Uniformly Weighted Moving Average (UWMA) chart
  •  Exponentially Weighted Moving Average (EWMA) chart
  •  Creating a UWMA control chart
  •  Creating an EWMA control chart
  •  CUmulative SUM (CUSUM) chart
  •  Creating a CUSUM control chart
  •  Study design
  •  Process capability
  •  Pareto analysis
  •  Study Designs
  •  Bibliography


Version 6.15
Published 18-Apr-2023
statistics software, statistical software for Excel
  • Products
  • Store 
  • Support
  • Blog
  • About us
  • Download trial
  •  Search
  •  Sign in
  •  Contact us
Analyse-it editions
  • Standard edition
  • Medical edition
  • Method Validation edition
  • Quality Control & Improvement edition
  • Ultimate edition

  • Blog  
  • About us
  • Contact us  
  • Privacy policy


Copyright 2026 Analyse-it Software, Ltd, Leeds, United Kingdom .
We use essential cookies to run the site, and optional analytics to improve the experience for visitors. For more information see our Privacy policy.