Statistics add-in software for statistical analysis in Excel
  • Tutorials
  • Correlation / PCA tutorial

Adding additional observations

If we have our own priorities regarding what constitutes our ideal neighborhood, this can be plotted to determine a list of neighborhoods closely matching those criteria.

  1. On the Biplot task pane, click Add new observations.
  2. In the Label edit box, enter My Ideal.
  3. In the edit boxes, enter Affordability = 70,Transit = 75, Shopping & Services = 75, Crime = 80, Food = 80, Schools = 80, Diversity = 75, Creative = 80, Housing Quality = 80, Green Space = 85, Wellness = 80, Nightlife = 85
  4. Click Recalculate.
    The results are calculated and the analysis report opens.
PCA biplot

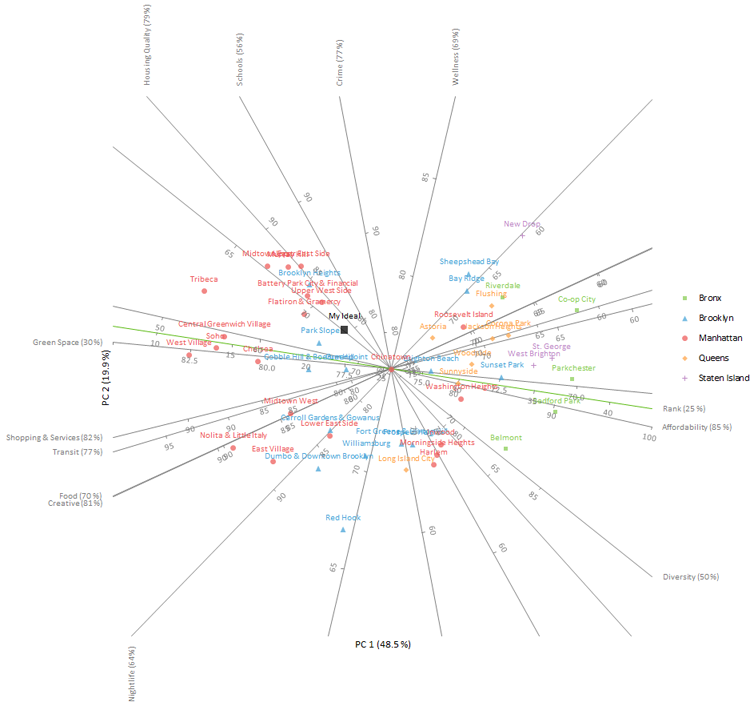
Our ideal neighborhood is interpolated onto the plot and labelled “My Ideal” (left and above the center of the plot). Neighborhoods that closely match those priorities will surround that point. Namely, these neighborhoods are Park Slope, Upper West Side, and the Flatiron District & Gramercy.

Next topic: Publishing the plot

  •  Tutorials
  •  Distribution tutorial
  •  Correlation / PCA tutorial
  •  Understanding the relationship between variables
  •  Reducing the dimensionality of the data
  •  Understanding the relationship between variables (revisited)
  •  Understanding the similarities between observations
  •  Grouping the observations
  •  Adding additional variables
  •  Adding additional observations
  •  Publishing the plot
  •  Compare groups means tutorial
  •  Association in 2-way contingency tables tutorial
  •  Simple linear regression tutorial
  •  Bland-Altman method comparison tutorial
  •  Estimating the precision of a measurement procedure (CLSI EP05-A3)
  •  Evaluating the linearity of a measurement procedure (CLSI EP06-A)
  •  Verifying the precision of a measurement procedure against a performance claim and estimating the bias (CLSI EP15-A3)
  •  Pareto charts tutorial
  •  Process control charts tutorial
  •  Process capability tutorial


Version 6.15
Published 18-Apr-2023
statistics software, statistical software for Excel
  • Products
  • Store 
  • Support
  • Blog
  • About us
  • Download trial
  •  Search
  •  Sign in
  •  Contact us
Analyse-it editions
  • Standard edition
  • Medical edition
  • Method Validation edition
  • Quality Control & Improvement edition
  • Ultimate edition

  • Blog  
  • About us
  • Contact us  
  • Privacy policy


Copyright 2026 Analyse-it Software, Ltd, Leeds, United Kingdom .
We use essential cookies to run the site, and optional analytics to improve the experience for visitors. For more information see our Privacy policy.