Statistics add-in software for statistical analysis in Excel
  • Tutorials
  • Correlation / PCA tutorial

Understanding the relationship between variables

When analyzing many variables, scatter plots and correlation coefficients can quickly uncover patterns and reduce a large amount of data to a subset of interesting relationships.

Correlation describes the strength of relationship between two variables. A correlation coefficient ranges from -1 to +1. +1 indicates a perfect positive linear relationship, and -1 indicates a perfect negative linear relationship. Zero indicates the variables are uncorrelated and there is no linear relationship. Normally the correlation coefficient lies somewhere between these values.

  1. Open the file tutorials\New York Neighborhoods.xlsx.
  2. Click a cell in the dataset.
  3. On the Analyse-it ribbon tab, in the Statistical Analyses group, click Multivariate, and then click Correlation Matrix.
    The analysis task pane opens.
  4. In the Model drop-down list, select Multivariate.
  5. In the Y variables list box, select Affordability, Transit, Shopping & Services, Crime, Food, Schools, Diversity, Creative, Housing Quality, Green Space, Wellness, Nightlife.
  6. Select Correlation and Color maps.
  7. On the Analyse-it ribbon tab, in the Correlation group, click Scatter matrix, and then click Scatter Plot with Density Ellipses and Histograms.
  8. In the Density ellipse edit box, enter 75%.
  9. Click Calculate.
    The results are calculated and the analysis report opens.

The scatter plot matrix shows plots for all of the pairs of variables, and each plot shows the relationship between a pair of variables. The red ellipse contains the middle 75% of the neighborhoods and indicates whether the two variables are positively, negatively, or not correlated.

Scatter plot matrix

The correlation matrix shows the correlation coefficient for each pair of variables. Positively correlated variables are blue and negatively correlated variables are red, with the intensity dependent on the magnitude of the correlation.

Correlation matrix
Based on the scatter plot matrix and the correlation matrix, a few relationships are obvious:
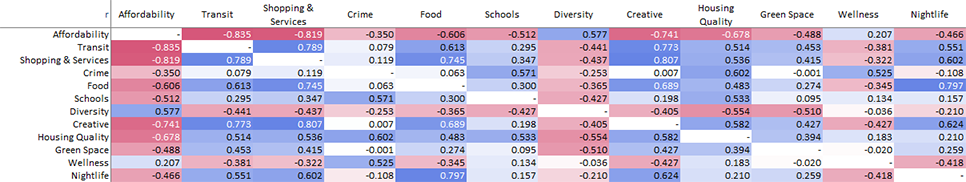
  • Neighborhoods with affordable housing don’t offer good transit.
  • Better shopping also means a greater number of restaurants.
  • There is less creative capital in neighborhoods with high diversity.
  • Wellness seems almost completely unrelated to other factors.
Next topic: Reducing the dimensionality of the data

  •  Tutorials
  •  Distribution tutorial
  •  Correlation / PCA tutorial
  •  Understanding the relationship between variables
  •  Reducing the dimensionality of the data
  •  Understanding the relationship between variables (revisited)
  •  Understanding the similarities between observations
  •  Grouping the observations
  •  Adding additional variables
  •  Adding additional observations
  •  Publishing the plot
  •  Compare groups means tutorial
  •  Association in 2-way contingency tables tutorial
  •  Simple linear regression tutorial
  •  Bland-Altman method comparison tutorial
  •  Estimating the precision of a measurement procedure (CLSI EP05-A3)
  •  Evaluating the linearity of a measurement procedure (CLSI EP06-A)
  •  Verifying the precision of a measurement procedure against a performance claim and estimating the bias (CLSI EP15-A3)
  •  Pareto charts tutorial
  •  Process control charts tutorial
  •  Process capability tutorial


Version 6.15
Published 18-Apr-2023
statistics software, statistical software for Excel
  • Products
  • Store 
  • Support
  • Blog
  • About us
  • Download trial
  •  Search
  •  Sign in
  •  Contact us
Analyse-it editions
  • Standard edition
  • Medical edition
  • Method Validation edition
  • Quality Control & Improvement edition
  • Ultimate edition

  • Blog  
  • About us
  • Contact us  
  • Privacy policy


Copyright 2026 Analyse-it Software, Ltd, Leeds, United Kingdom .
We use essential cookies to run the site, and optional analytics to improve the experience for visitors. For more information see our Privacy policy.