Statistics add-in software for statistical analysis in Excel
  • Tutorials
  • Correlation / PCA tutorial

Grouping the observations

Rather than focusing on individual neighborhoods, we may group the neighborhoods by the borough they are located in and plot the points using different symbols and colors.

  1. On the Biplot task pane, click Vary point color / symbol.
  2. In the Group / Color / Symbol drop-down list, select Borough.
  3. Click Recalculate.
    The results are calculated and the analysis report opens.
PCA biplot

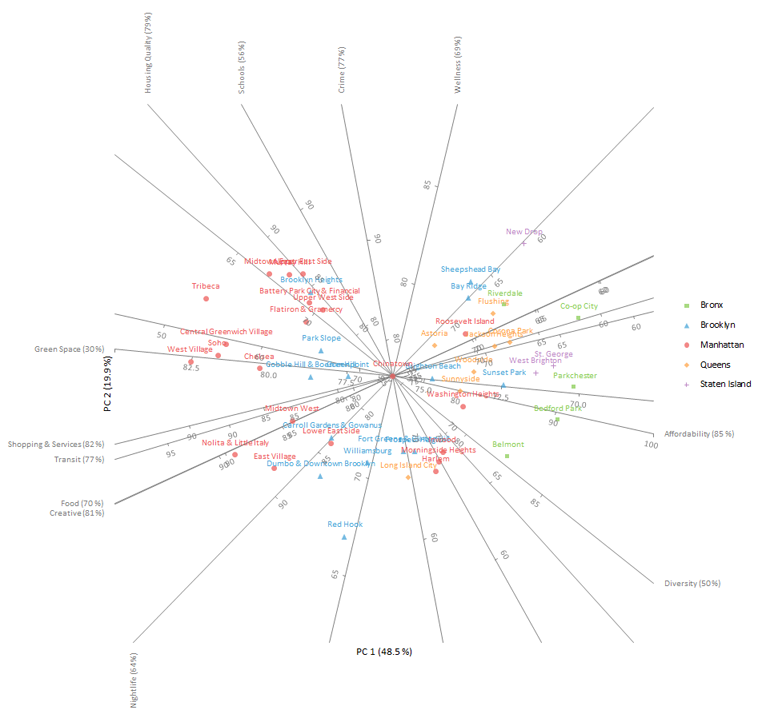
It is easy to see that the neighborhoods in The Bronx are more affordable than those in Manhattan and that they have lower scores for shopping & services, transit, food and creative. The axes are labelled on the edge with higher values for convenience.

Next topic: Adding additional variables

  •  Tutorials
  •  Distribution tutorial
  •  Correlation / PCA tutorial
  •  Understanding the relationship between variables
  •  Reducing the dimensionality of the data
  •  Understanding the relationship between variables (revisited)
  •  Understanding the similarities between observations
  •  Grouping the observations
  •  Adding additional variables
  •  Adding additional observations
  •  Publishing the plot
  •  Compare groups means tutorial
  •  Association in 2-way contingency tables tutorial
  •  Simple linear regression tutorial
  •  Bland-Altman method comparison tutorial
  •  Estimating the precision of a measurement procedure (CLSI EP05-A3)
  •  Evaluating the linearity of a measurement procedure (CLSI EP06-A)
  •  Verifying the precision of a measurement procedure against a performance claim and estimating the bias (CLSI EP15-A3)
  •  Pareto charts tutorial
  •  Process control charts tutorial
  •  Process capability tutorial


Version 6.15
Published 18-Apr-2023
statistics software, statistical software for Excel
  • Products
  • Store 
  • Support
  • Blog
  • About us
  • Download trial
  •  Search
  •  Sign in
  •  Contact us
Analyse-it editions
  • Standard edition
  • Medical edition
  • Method Validation edition
  • Quality Control & Improvement edition
  • Ultimate edition

  • Blog  
  • About us
  • Contact us  
  • Privacy policy


Copyright 2026 Analyse-it Software, Ltd, Leeds, United Kingdom .
We use essential cookies to run the site, and optional analytics to improve the experience for visitors. For more information see our Privacy policy.