Statistics add-in software for statistical analysis in Excel
  • Statistical Reference Guide
  • Fit model
  • Linear fit

Effect leverage plot

An effect leverage plot, also known as added variable plot or partial regression leverage plot, shows the unique effect of a term in the model.


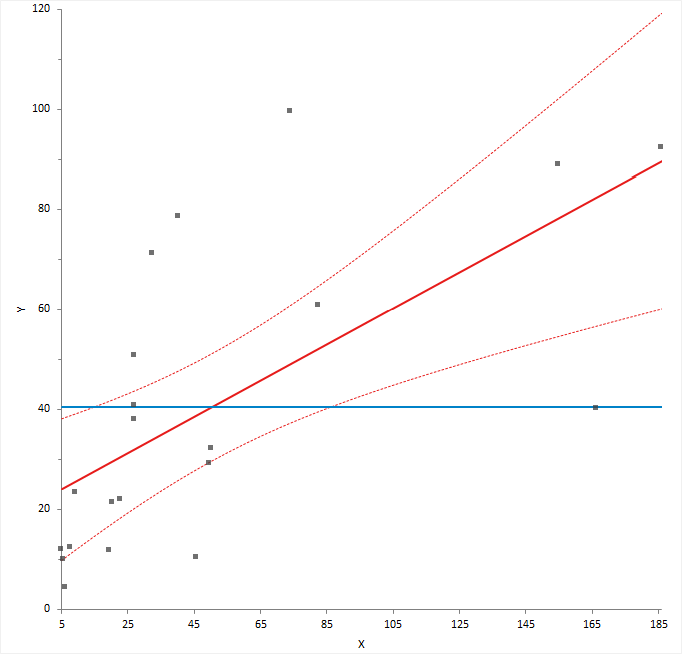
A horizontal line shows the constrained model without the term; a slanted line shows the unconstrained model with the term. The plot shows the unique effect of adding a term to a model assuming the model contains all the other terms and the influence of each point on the effect of term hypothesis test. Points further from the horizontal line than the slanted line effectively try to make the hypothesis test more significant, and those closer to the horizontal than the slanted line try to make the hypothesis test less significant. When the confidence band fully encompasses the horizontal line, you can conclude the term does not contribute to the model. It is equivalent to a non-significant F-test for the partial effect of the term. 

You can also use the plot to identify cases that are likely to influence the parameter estimates. Points furthest from the intersection of the horizontal and slanted lines have high leverage, and effectively try to pull the line towards them. A high leverage point that is distant from the bulk of the points can have a large influence the parameter estimates for the term.

Finally, you can use the plot to spot near collinearity between terms. When the terms are collinear, the points collapse toward a vertical line.

Related concepts
Effect of terms hypothesis test
Available in Analyse-it Editions
Standard edition
Method Validation edition
Quality Control & Improvement edition
Ultimate edition

  •  What is Analyse-it?
  •  What's new?
  •  Administrator's Guide
  •  User's Guide
  •  Statistical Reference Guide
  •  Distribution
  •  Compare groups
  •  Compare pairs
  •  Contingency tables
  •  Correlation and association
  •  Principal component analysis (PCA)
  •  Factor analysis (FA)
  •  Item reliability
  •  Fit model
  •  Linear fit
  •  Simple regression models
  •  Fitting a simple linear regression
  •  Advanced models
  •  Fitting a multiple linear regression
  •  Performing ANOVA
  •  Performing 2-way or higher factorial ANOVA
  •  Performing ANCOVA
  •  Fitting an advanced linear model
  •  Scatter plot
  •  Summary of fit
  •  Parameter estimates
  •  Effect of model hypothesis test
  •  ANOVA table
  •  Predicted against actual Y plot
  •  Lack of Fit
  •  Effect of terms hypothesis test
  •  Effect leverage plot
  •  Effect means
  •  Plotting main effects and interactions
  •  Multiple comparisons
  •  Multiple comparison procedures
  •  Comparing effect means
  •  Residual plot
  •  Residuals - normality
  •  Residuals - independence
  •  Plotting residuals
  •  Outlier and influence plot
  •  Identifying outliers and other influential points
  •  Prediction
  •  Making predictions
  •  Making inverse predictions
  •  Saving variables
  •  Logistic / Probit fit
  •  Study design
  •  Method comparison / Agreement
  •  Measurement systems analysis (MSA)
  •  Reference interval
  •  Diagnostic performance
  •  Survival/Reliability
  •  Control charts
  •  Process capability
  •  Pareto analysis
  •  Study Designs
  •  Bibliography


Version 6.15
Published 18-Apr-2023
statistics software, statistical software for Excel
  • Products
  • Store 
  • Support
  • Blog
  • About us
  • Download trial
  •  Search
  •  Sign in
  •  Contact us
Analyse-it editions
  • Standard edition
  • Medical edition
  • Method Validation edition
  • Quality Control & Improvement edition
  • Ultimate edition

  • Blog  
  • About us
  • Contact us  
  • Privacy policy


Copyright 2026 Analyse-it Software, Ltd, Leeds, United Kingdom .
We use essential cookies to run the site, and optional analytics to improve the experience for visitors. For more information see our Privacy policy.