Statistics add-in software for statistical analysis in Excel
  • Statistical Reference Guide
  • Fit model
  • Linear fit

Predicted against actual Y plot

A predicted against actual plot shows the effect of the model and compares it against the null model.


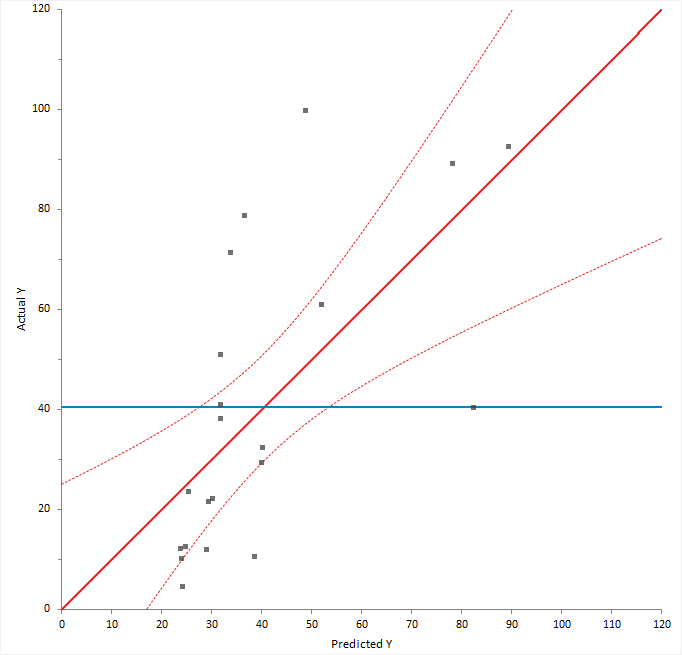
For a good fit, the points should be close to the fitted line, with narrow confidence bands. Points on the left or right of the plot, furthest from the mean, have the most leverage and effectively try to pull the fitted line toward the point. Points that are vertically distant from the line represent possible outliers. Both types of points can adversely affect the fit.

The plot is also a visualization of the ANOVA table, except each observation is shown so you can gain much more insight than just the hypothesis test. The confidence interval around the full model line portrays the F-test that all the parameters except the intercept are zero. When the confidence interval does not include the horizontal null model line, the hypothesis test is significant.

Related concepts
Effect of model hypothesis test
Available in Analyse-it Editions
Standard edition
Method Validation edition
Quality Control & Improvement edition
Ultimate edition

  •  What is Analyse-it?
  •  What's new?
  •  Administrator's Guide
  •  User's Guide
  •  Statistical Reference Guide
  •  Distribution
  •  Compare groups
  •  Compare pairs
  •  Contingency tables
  •  Correlation and association
  •  Principal component analysis (PCA)
  •  Factor analysis (FA)
  •  Item reliability
  •  Fit model
  •  Linear fit
  •  Simple regression models
  •  Fitting a simple linear regression
  •  Advanced models
  •  Fitting a multiple linear regression
  •  Performing ANOVA
  •  Performing 2-way or higher factorial ANOVA
  •  Performing ANCOVA
  •  Fitting an advanced linear model
  •  Scatter plot
  •  Summary of fit
  •  Parameter estimates
  •  Effect of model hypothesis test
  •  ANOVA table
  •  Predicted against actual Y plot
  •  Lack of Fit
  •  Effect of terms hypothesis test
  •  Effect leverage plot
  •  Effect means
  •  Plotting main effects and interactions
  •  Multiple comparisons
  •  Multiple comparison procedures
  •  Comparing effect means
  •  Residual plot
  •  Residuals - normality
  •  Residuals - independence
  •  Plotting residuals
  •  Outlier and influence plot
  •  Identifying outliers and other influential points
  •  Prediction
  •  Making predictions
  •  Making inverse predictions
  •  Saving variables
  •  Logistic / Probit fit
  •  Study design
  •  Method comparison / Agreement
  •  Measurement systems analysis (MSA)
  •  Reference interval
  •  Diagnostic performance
  •  Survival/Reliability
  •  Control charts
  •  Process capability
  •  Pareto analysis
  •  Study Designs
  •  Bibliography


Version 6.15
Published 18-Apr-2023
statistics software, statistical software for Excel
  • Products
  • Store 
  • Support
  • Blog
  • About us
  • Download trial
  •  Search
  •  Sign in
  •  Contact us
Analyse-it editions
  • Standard edition
  • Medical edition
  • Method Validation edition
  • Quality Control & Improvement edition
  • Ultimate edition

  • Blog  
  • About us
  • Contact us  
  • Privacy policy


Copyright 2026 Analyse-it Software, Ltd, Leeds, United Kingdom .
We use essential cookies to run the site, and optional analytics to improve the experience for visitors. For more information see our Privacy policy.