
Analyse-it logo
Analyse-it logo Analyse-it logo
  • Products

    Editions

    Standard Edition Standard US$ 155/yr The statistics behind most research. Included in every edition.
    • ANOVA
    • Contingency tables
    • Correlation
    • Descriptive statistics
    • Hypothesis tests
    • Logistic regression
    • Principal component analysis
    • Regression
    Quality Control Improvement Quality Control US$ 290/yr For monitoring a process over time and detecting when it changes.
    • Control charts
    • Pareto analysis
    • Process capability
    MEdical Edition Medical US$ 340/yr For biomedical and clinical research.
    • Bland-Altman agreement
    • Diagnostic accuracy
    • Reference intervals
    • Survival analysis
    Method Validation Edition Method Validation US$ 475/yr For establishing and verifying how a measurement method performs.
    • Bland-Altman agreement
    • Deming regression
    • Detection capability
    • Diagnostic performance
    • Linearity
    • Measurement system analysis
    • Method comparison
    • Passing-Bablok regression
    • Precision
    • Reference intervals
    Ultimate Icon Ultimate US$ 575/yr For laboratories that do method validation and quality control.

    All features from every edition in a single licence.

    Solutions

    • IVD manufacturers
    • Clinical laboratories
    • Analytical & testing laboratories
    • Biomedical & clinical research
    • Manufacturing & process quality

    Case studies

    • EOC
    • National reference laboratory

    Validation and accuracy

    • How we develop and validate Analyse-it
    • NIST StRD numerical accuracy benchmarks
    Upgrade or renew Resellers
    Compare editions
  • Pricing
  • Learn

    Guides

    Start here

    • I am bringing a method into service
    • I do not know whether I am validating or verifying
    • I have data and do not know which test to use
    • I have the results and have to write them up
    • I need to put a process under control

    Method validation

    • Getting started
    • Precision & verification
    • Detection & measuring range
    • Method comparison & agreement
    • Total error & performance goals
    • Regulation & accreditation
    • Reference intervals

    Diagnostic & clinical

    • Diagnostic performance
    • Survival analysis

    Quality control

    • Quality control & SPC

    General statistics

    • Statistics fundamentals
    • ANOVA & multiple comparisons
    • Regression & multivariate
    Blog
    All 70 guides
  • Support

    Support

    Example analyses Fifty worked analyses, each with the data behind it.
    Download the latest version Licensed users — enter your product key to get version 6.22.1. Release history, and older versions →
    Analyse-it not starting? Run the trouble-shooter. It tries the common fixes.
    Knowledge base Licensing, the free trial, installation and validation, answered.
    Contact support Your message goes to the people who build Analyse-it.
    Consultancy & training Courses and consultancy from independent specialists.

    Statistical reference guide

    • Distribution
    • Compare groups
    • Compare pairs
    • Contingency tables
    • Correlation and association
    • Principal component analysis (PCA)
    • Factor analysis (FA)
    • Item reliability
    • Fit model
    • Method comparison
    • Measurement systems analysis (MSA)
    • Reference interval
    • Diagnostic performance
    • Survival & reliability
    • Control charts
    • Process capability
    • Pareto analysis

    Getting started with Analyse-it

    • Tutorials

    User guide

    • Preparing data for analysis
    • Creating an analysis
    • Recalculating an analysis

    Installers & administrator’s guide

    • System requirements
    • Installing the software
    • Deploying to many computers, or to every user
    • Activating a license
    • Moving a license to another computer
    • Using a concurrent-user license
    • Updating the software
    • Troubleshooting

    Validation and accuracy

    • How we develop and validate Analyse-it
    • NIST StRD numerical accuracy benchmarks
    Complete guide (PDF)
    All support & documentation
  • About us
Download trial

18-Feb-2013 Quantiles, Percentiles: Why so many ways to calculate them?

In development Statistics Using Analyse-it

What is a sample quantile or percentile? Take the 0.25 quantile (also known as the 25th percentile, or 1st quartile) -- it defines the value (let’s call it x) for a random variable, such that the probability that a random observation of the variable is less than x is 0.25 (25% chance).

A simple question, with a simple definition? The problem is calculating quantiles. The formulas are simple enough, but a take a quick look on Wikipedia and you’ll see there are at least 9 alternative methods http://en.wikipedia.org/wiki/Quantile. Consequently, statistical packages use different formulas to calculate quantiles. And we're sometimes asked why the quantiles calculated by Analyse-it sometimes don’t agree with Excel, SAS, or R.

How are quantiles and percentiles calculated in Excel, SAS and R?

Excel uses formula R-7 (in the Wikipedia article) to calculate the QUARTILE and PERCENTILE functions. Excel 2010 introduced two new functions that use slightly different formulas, with different denominators: PERCENTILE.INC and PERCENTILE.EXC.

SAS, R and some other packages let you choose which formula is used to calculate the quantiles. While this provides some flexibility, as it lets you reproduce statistics calculated using another package, the options can be confusing. Most non-statisticians don’t know when to use one method over another. When would you use the "Linear interpolation of the empirical distribution function" versus the "Linear interpolation of the modes for the order statistics for the uniform distribution on [0,1]" method?

Why so many ways to calculate quantiles?

Many of the formulas to calculate quantiles were developed when today's computing power wasn’t available. Believe it or not some are nearly 100 years old! Now they’re merely historical curiosities, but some remain in packages like SPSS that have their roots in the 1970s.

During the development of Analyse-it we always ask: what’s the latest or best (in some sense) method we can use to calculate this statistic?

Filling Analyse-it with all the formulas invented would be easy. But that doesn’t help the average user – users that don’t have the knowledge, or can’t invest the time needed to research the most suitable method. Instead we look at published research to find the best method. If there is no single best method we implement a small set of alternatives that provide the best solution in specific situations – situations we can clearly define and explain.

Every statistical test and estimator included in Analyse-it has to pass this test to make the cut. We applied these principles when it came to quantiles.

Hyndman and Fan published a paper on calculating quantiles in 1996. It evaluated the methods used by popular statistics packages to calculate quantiles, with the intention to find a consensus on which all statistics packages could standardise. Of the 9 formulas used, 4 formulas satisfied five of the six properties desirable for a sample quantile and their derivations were deemed justified. Of those 4 formulas, Hyndman and Fan felt the "Linear interpolation of the approximate medians for order statistics" (method R-8 on the Wikipedia page) formula was best due to the approximately median-unbiased estimates of the quantiles, regardless of the distribution. Of the remaining formulas, 2 were also distribution-free but were not unbiased, and the other was approximately unbiased only for the normal distribution. They concluded that formula R-8 should be adopted as the standard across software packages.

That was 1996. Unfortunately little progress has since been made toward standardisation. Many statistical packages have a long history (even Analyse-it is over 15-years old now!) and most tend to stick to the same method to maintain backwards computability with older versions. Even R, a relative newcomer, doesn't use the recommended formula. It uses formula R-7 by default, for compatibility with S (http://stat.ethz.ch/R-manual/R-patched/library/stats/html/quantile.html). Minitab, SPSS and SAS use R-6.

Consistency between the statistics and plots.

To complicate the situation further quantiles and percentiles are also used in statistical plots. The Tukey box-plot, for example, uses the 1st and 3rd quartiles (0.25 and 0.75 quantiles) for the extent of the box element of the plot.

Frigge, Hoaglin and Iglewicz published a paper in 1989 that looked at how quantiles were calculated in 3 of the major statistical packages. They found that because each package used a different formula, each identified different observations as outliers. Confusing! They recommended statistical packages use the "Ideal or Machine Forths" formula for consistency, which is equivalent to using method R-8 to calculate quartiles.

What technique does Analyse-it use?

By now you can probably guess that we chose to use R-8 formula in Analyse-it.
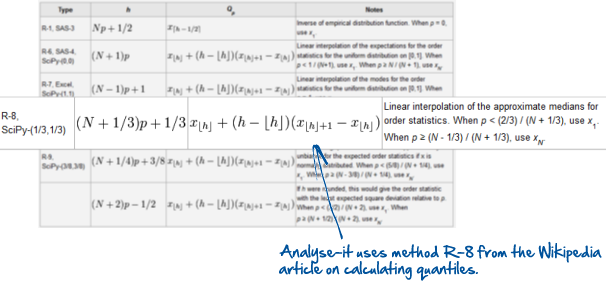

Analyse-it uses the R-8 formula (see Wikipedia) to calculate quantiles and percentile

Formula R-8 is recommended as the standard in both papers cited above, for descriptive statistics and plots. And using a single formula avoids the confusing situation you’ll sometimes see with other statistics packages, where the 1st and 3rd quartiles used for the box-plot differ from sample .25 and .75 quantiles.

Of course using formula R-8 can lead to some differences between the quantiles calculated by Analyse-it and other packages, though often you'll only see it with small sample sizes. If possible, as you can in R, we recommend you change the quantile calculation to use the R-8 formula. If not, you can be sure the statistics calculated by Analyse-it are absolutely correct. And you can cite this article as to why!

Further reading:

Hyndman, R.J.; Fan, Y. (November 1996). "Sample Quantiles in Statistical Packages". The American Statistician 50 (4): 361–365. 

Frigge, Michael; Hoaglin, David C.; Iglewicz, Boris (February 1989). "Some Implementations of the Boxplot". The American Statistician 43 (1): 50–54.

Previous post
Analyse-it 3.10 now includes a statistical reference guide
Next post
Announcing the Analyse-it Method Evaluation Edition 3.5

Comments

It's curious that you refer to R as a "relative newcomer" -- relative to SAS, perhaps? R's parent, S, was developed in the 1970's.
Valerie Partridge
Tuesday, 19 February, 2013 16:59
The reference to the paper by Hoaglin et al is very important indeed & clearly illustrates some of the serious issues & the confusions.

As an expert in exploratory, robust & resistant and non-parametric stats, I'm pleased to see attention being paid to this. Hoaglin was part of John Tukey's group who were major pioneers in exploratory statistics. It is part of the modern "data-driven" approach to statistics (see the book with that title by Peter Sprent). Peter Sprent's books are all worth a look. I have written several book chapters on these topics as an applied statistician.
John Thompson
Wednesday, 20 February, 2013 8:15

Comments are now closed.

Tags

  • All (65)
  • Business (10) 
  • Case studies (2) 
  • Excel (6) 
  • In development (16) 
  • Method validation (19) 
  • Plots (2) 
  • Press releases (1) 
  • Publications (1) 
  • Releases (35) 
  • Statistics (17) 
  • Using Analyse-it (31) 

Latest posts

  • A New Year. A New Edition.
  • Analyse-it v6.10: Survival Analysis and other improvements
  • Analyse-it v5.90: Support for the updated CLSI EP6-Ed2 protocol and inverse predictions
  • Analyse-it 5.50 to 5.65: Recent improvements
  • COVID-19: Calculating the detection limit for a SARS-CoV-2 RT-PCR assay using Analyse-it
  • COVID-19: Calculating PPA/NPA agreement measures using Analyse-it
  • Diagnostic accuracy (sensitivity/specificity) versus agreement (PPA/NPA) statistics
  • COVID-19: Establishing the diagnostic accuracy (sensitivity/specificity) of a test using Analyse-it
  • Why the diagnostic test 'accuracy' statistic is useless
  • Sensitivity/Specificity and The Importance of Predictive Values for a COVID-19 test

Most popular posts

  • Announcing the Analyse-it Quality Control & Improvement Edition
  • Analyse-it 4.0 released: Support for CLSI guidelines, and Measurement Systems Analysis
  • Analyse-it 3.80 released: Principal Component Analysis (PCA)
  • Recent improvements in Analyse-it 3.76 and our first video tutorial!
  • Our software development and validation process
  • The numerical accuracy of Analyse-it against the NIST StRD
  • Quantiles, Percentiles: Why so many ways to calculate them?
  • Handbook of Parametric & Non-parametric Statistical procedures
  • A sombre note: Professor Rick Jones
Products
  • All editions
  • Standard Edition
  • Medical Edition
  • Quality Control & Improvement Edition
  • Method Validation Edition
  • Ultimate Edition
  • Compare Editions
  • Pricing
Solutions
  • IVD manufacturers
  • Clinical laboratories
  • Analytical & testing laboratories
  • Manufacturing & process quality
  • Biomedical & clinical research
Learn
  • All guides
  • Choosing a statistical test
  • Method validation roadmap
  • Choosing a method comparison
  • ROC curves & diagnostic performance
  • Choosing a control chart
Support
  • Support centre
  • Tutorials
  • Knowledge base
  • Numerical accuracy
  • Download latest version
  • Release history
Company
  • About us
  • Published research
  • Contact us
  • Development & validation
  • Blog
  • Privacy policy

Get started

  • Download free trial
  • Sign In

© 2026 Analyse-it® Software, Ltd. All rights reserved.
GBLeeds, England · Founded 1997 · Registered in England & Wales, company no. 3022685

Statistical analysis, method validation, diagnostic performance and quality control software for Microsoft Excel.

We value your privacy

We use essential cookies to run the site. With your permission we'd also like to use analytics and advertising cookies to see how visitors find and use Analyse-it, so we can keep improving it and reach more people like you.

You can change your mind at any time, see our Privacy policy.