
8-May-2020 COVID-19: Calculating PPA/NPA agreement measures using Analyse-it
Following our last blog post, today, we will show how to calculate binary agreement using the Analyse-it Method Validation edition. The CLSI EP12: User Protocol for Evaluation of Qualitative Test Performance protocol is a useful companion resource for laboratories and diagnostic companies developing qualitative diagnostic tests.
In Analyse-it, you should arrange the data in frequency or case form, as discussed in the blog post: Using Analyse-it to establish the diagnostic accuracy (sensitivity/specificity) of a COVID-19 test. You can find an example of both and follow the steps below, using the workbook COVID-19 Agreement Example.xlsx.
To Analyse-it:
- Select a cell in the dataset.
- On the Analyse-it ribbon tab, in the Statistical Analyses group, click Method Comparison, and then click Binary (PPA/NPA) or PPA/NPA depending on the version of Analyse-it you are using.
The analysis task pane opens.
- In the X (Reference / Comparative) drop-down list, select the Comparative method variable.
- In the Y (Test /New) drop-down list, select the Test method variable.
- If the data are in frequency form, in the Frequency drop-down list, select the frequency variable # containing the counts.
- Select the Agreement by category checkbox, and in the Measure drop-down, select Reference to calculate the proportion of the Test method results that agree with the Comparative method.
NOTE: The Average method is useful when comparing two laboratories or observers where neither is considered a natural comparator. The reference method is asymmetric, and the result will depend on the assignment of the X and Y methods, whereas the average method is symmetric, and the result does not change when swapping the X and Y methods.
INFO: Older versions of Analyse-it do not support the Average method, and the Agreement by category checkbox is called Agreement.
- Click Calculate.
The analysis report shows positive and negative agreement statistics.
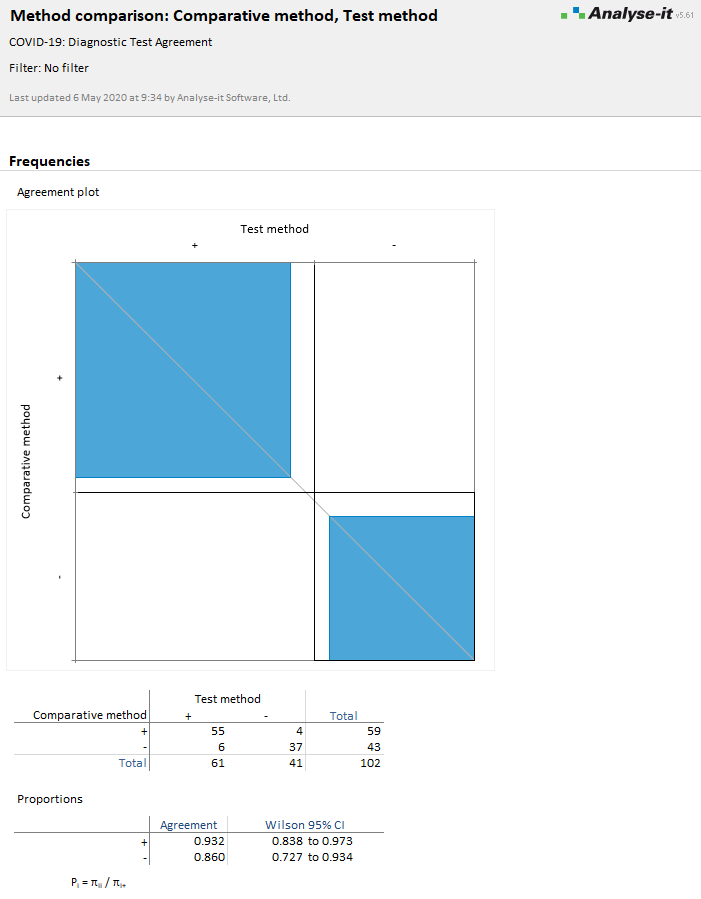
The positive agreement is 93.2%, and the negative agreement is 86.0%. You can see from the contingency table that the Comparative method identified 59 positives and 43 negatives, whereas the Test method identified 61 positives, 41 negatives. There are 55 positive agreements, 37 negative agreements, and 4 disagreements where the Comparative method is positive and the Test method negative, 6 disagreements where the Comparative method is negative and the Test method positive.
The agreement plot is a visual representation of the agreement:
- Black rectangle outlines represent the maximum agreement possible (as represented by the marginal totals of the contingency table). If the marginal totals are the same, that is, both tests identify the same number of positives and negatives, the rectangles will be square and intersect with the diagonal identity line.
- If one test tends to categorize more results as positive/negative than another, the rectangle will not be square and will not intersect the diagonal.
- Blue filled rectangles represent the observed agreement (as represented by the diagonal cells of the contingency table). If you read down the vertical axis labeled Comparative method, this is an indication of the Test method agreement with the Comparative method. Likewise, if you read across the horizontal axis, this is the Comparative method agreement with the Test method.
- The relationship between the area of the shaded to the unshaded rectangle is a measure of the average agreement.
For more information, see our online documentation:
Agreement measures for binary and semi-quantitative data
Agreement plot
Estimating agreement between two binary or semi-quantitative methods
Comments
Comments are now closed.