
Analyse-it logo
Analyse-it logo Analyse-it logo
  • Products

    Editions

    Standard Edition Standard US$ 155/yr The statistics behind most research. Included in every edition.
    • ANOVA
    • Contingency tables
    • Correlation
    • Descriptive statistics
    • Hypothesis tests
    • Logistic regression
    • Principal component analysis
    • Regression
    Quality Control Improvement Quality Control US$ 290/yr For monitoring a process over time and detecting when it changes.
    • Control charts
    • Pareto analysis
    • Process capability
    MEdical Edition Medical US$ 340/yr For biomedical and clinical research.
    • Bland-Altman agreement
    • Diagnostic accuracy
    • Reference intervals
    • Survival analysis
    Method Validation Edition Method Validation US$ 475/yr For establishing and verifying how a measurement method performs.
    • Bland-Altman agreement
    • Deming regression
    • Detection capability
    • Diagnostic performance
    • Linearity
    • Measurement system analysis
    • Method comparison
    • Passing-Bablok regression
    • Precision
    • Reference intervals
    Ultimate Icon Ultimate US$ 575/yr For laboratories that do method validation and quality control.

    All features from every edition in a single licence.

    Solutions

    • IVD manufacturers
    • Clinical laboratories
    • Analytical & testing laboratories
    • Biomedical & clinical research
    • Manufacturing & process quality

    Case studies

    • EOC
    • National reference laboratory

    Validation and accuracy

    • How we develop and validate Analyse-it
    • NIST StRD numerical accuracy benchmarks
    Upgrade or renew Resellers
    Compare editions
  • Pricing
  • Learn

    Guides

    Start here

    • I am bringing a method into service
    • I do not know whether I am validating or verifying
    • I have data and do not know which test to use
    • I have the results and have to write them up
    • I need to put a process under control

    Method validation

    • Getting started
    • Precision & verification
    • Detection & measuring range
    • Method comparison & agreement
    • Total error & performance goals
    • Regulation & accreditation
    • Reference intervals

    Diagnostic & clinical

    • Diagnostic performance
    • Survival analysis

    Quality control

    • Quality control & SPC

    General statistics

    • Statistics fundamentals
    • ANOVA & multiple comparisons
    • Regression & multivariate
    Blog
    All 70 guides
  • Support

    Support

    Example analyses Fifty worked analyses, each with the data behind it.
    Download the latest version Licensed users — enter your product key to get version 6.21.2. Release history, and older versions →
    Analyse-it not starting? Run the trouble-shooter. It tries the common fixes.
    Knowledge base Licensing, the free trial, installation and validation, answered.
    Contact support Your message goes to the people who build Analyse-it.
    Consultancy & training Courses and consultancy from independent specialists.

    Statistical reference guide

    • Distribution
    • Compare groups
    • Compare pairs
    • Contingency tables
    • Correlation and association
    • Principal component analysis (PCA)
    • Factor analysis (FA)
    • Item reliability
    • Fit model
    • Method comparison
    • Measurement systems analysis (MSA)
    • Reference interval
    • Diagnostic performance
    • Survival & reliability
    • Control charts
    • Process capability
    • Pareto analysis

    Getting started with Analyse-it

    • Tutorials

    User guide

    • Preparing data for analysis
    • Creating an analysis
    • Recalculating an analysis

    Installers & administrator’s guide

    • System requirements
    • Installing the software
    • Deploying to many computers, or to every user
    • Activating a license
    • Moving a license to another computer
    • Using a concurrent-user license
    • Updating the software
    • Troubleshooting

    Validation and accuracy

    • How we develop and validate Analyse-it
    • NIST StRD numerical accuracy benchmarks
    Complete guide (PDF)
    All support & documentation
  • About us
Download trial

7-Apr-2020 Why the diagnostic test 'accuracy' statistic is useless

Method validation Statistics Using Analyse-it

In our last post, we mentioned that the 'accuracy' statistic, also known as the probability of a correct result, was a useless measure for diagnostic test performance. Today we'll explain why.

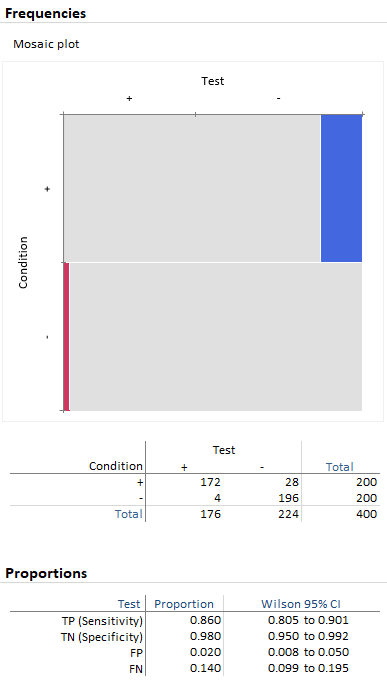
Let's take a hypothetical test with a sensitivity of 86% and specificity of 98%.

As a first scenario we simulated test results on 200 subjects with, and 200 without, the condition. The accuracy statistic (TP+TN)/N is equal to (172+196)/400 = 92%. See below:
accuracy1

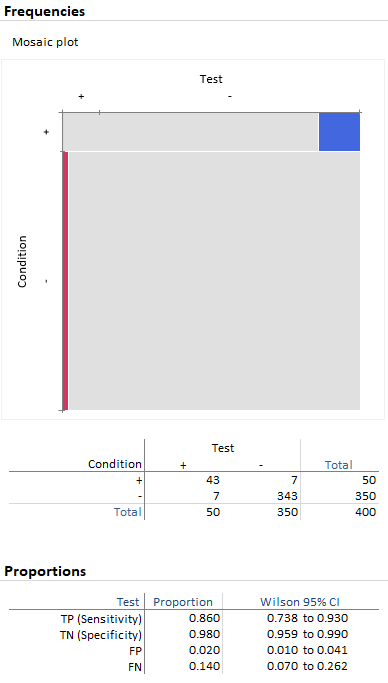
In a second scenario we again simulated test results on 400 subjects, but only 50 with, and 350 without, the condition. The accuracy statistic is (43+343)/400 = 96.5%. See below:
accuracy2

The accuracy statistic is effectively a weighted average of sensitivity and specificity, with weights equal to the sample prevalence P(D=1) and the complement of the prevalence (that is, P(D=0) = 1-P(D=1)).

Accuracy = P(TP or TN) = (TP+TN)/N = Sensitivity * P(D=1) + Specificity * P(D=0)

Therefore as the prevalence in the sample changes so does the statistic. The prevalence of the condition in the sample may vary due to the availability of subjects or it may be fixed during the design of the study. It's easy to see how to manipulate the accuracy statistic to weigh in favor of the measure that performs best.

Finally, the 'accuracy' statistic is not a good way of comparing diagnostic tests. As illustrated above, it is affected by the prevalence in the samples of the tests. And, even given two tests, with sample prevalence 50%, suppose test A has a sensitivity of 100%, but specificity 0%, and test B has a sensitivity of 0% and specificity 100%. Both tests give the same probability of a correct result, yet the two tests are radically different.

The measures of the accuracy of a diagnostic test are sensitivity and specificity. The accuracy statistic, the probability of a correct test result, is not a measure of the intrinsic accuracy of a test.

For more information, see our online documentation:
Measures of diagnostic accuracy

Previous post
Sensitivity/Specificity and The Importance of Predictive Values for a COVID-19 test
Next post
COVID-19: Establishing the diagnostic accuracy (sensitivity/specificity) of a test using Analyse-it

Comments

Comments are now closed.

Tags

  • All (65)
  • Business (10) 
  • Case studies (2) 
  • Excel (6) 
  • In development (16) 
  • Method validation (19) 
  • Plots (2) 
  • Press releases (1) 
  • Publications (1) 
  • Releases (35) 
  • Statistics (17) 
  • Using Analyse-it (31) 

Latest posts

  • A New Year. A New Edition.
  • Analyse-it v6.10: Survival Analysis and other improvements
  • Analyse-it v5.90: Support for the updated CLSI EP6-Ed2 protocol and inverse predictions
  • Analyse-it 5.50 to 5.65: Recent improvements
  • COVID-19: Calculating the detection limit for a SARS-CoV-2 RT-PCR assay using Analyse-it
  • COVID-19: Calculating PPA/NPA agreement measures using Analyse-it
  • Diagnostic accuracy (sensitivity/specificity) versus agreement (PPA/NPA) statistics
  • COVID-19: Establishing the diagnostic accuracy (sensitivity/specificity) of a test using Analyse-it
  • Why the diagnostic test 'accuracy' statistic is useless
  • Sensitivity/Specificity and The Importance of Predictive Values for a COVID-19 test

Most popular posts

  • Announcing the Analyse-it Quality Control & Improvement Edition
  • Analyse-it 4.0 released: Support for CLSI guidelines, and Measurement Systems Analysis
  • Analyse-it 3.80 released: Principal Component Analysis (PCA)
  • Recent improvements in Analyse-it 3.76 and our first video tutorial!
  • Our software development and validation process
  • The numerical accuracy of Analyse-it against the NIST StRD
  • Quantiles, Percentiles: Why so many ways to calculate them?
  • Handbook of Parametric & Non-parametric Statistical procedures
  • A sombre note: Professor Rick Jones
Products
  • All editions
  • Standard Edition
  • Medical Edition
  • Quality Control & Improvement Edition
  • Method Validation Edition
  • Ultimate Edition
  • Compare Editions
  • Pricing
Solutions
  • IVD manufacturers
  • Clinical laboratories
  • Analytical & testing laboratories
  • Manufacturing & process quality
  • Biomedical & clinical research
Learn
  • All guides
  • Choosing a statistical test
  • Method validation roadmap
  • Choosing a method comparison
  • ROC curves & diagnostic performance
  • Choosing a control chart
Support
  • Support centre
  • Tutorials
  • Knowledge base
  • Numerical accuracy
  • Download latest version
  • Release history
Company
  • About us
  • Published research
  • Contact us
  • Development & validation
  • Blog
  • Privacy policy

Get started

  • Download free trial
  • Sign In

© 2026 Analyse-it® Software, Ltd. All rights reserved.

Statistical analysis, method validation, diagnostic performance and quality control software for Microsoft Excel.

We value your privacy

We use essential cookies to run the site. With your permission we'd also like to use analytics and advertising cookies to see how visitors find and use Analyse-it, so we can keep improving it and reach more people like you.

You can change your mind at any time, see our Privacy policy.