
27-Jul-2022 Analyse-it v6.10: Survival Analysis and other improvements
We’re happy to announce a couple of major additions to the Analyse-it Ultimate edition: Kaplan-Meier survival curves and Cox’s proportional hazards survival model. There are also improvements for users of other editions.
If you have active maintenance you can download and install the update now, see: updating the software or visit the download page. If maintenance on your license has expired, you can renew it to get this update and forthcoming updates, see renew maintenance. If you already have another edition of Analyse-it, you can upgrade to the Ultimate edition for just the difference in cost, see upgrading Analyse-it .
Kaplan-Meier survival curves (Ultimate edition)
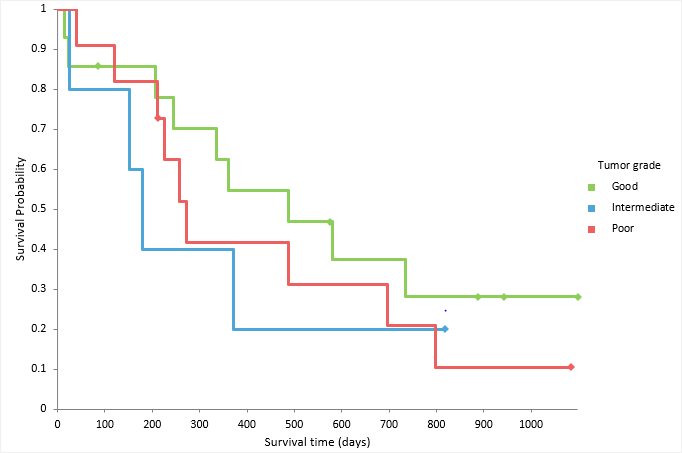
Kaplan-Meier survival curves describe and visualize time-to-event data. They are often used in survival and reliability analysis to model time to death or time to failure of a component. You can visualize multiple survival functions, with confidence bands, and test for differences between them. In addition you can describe the key quantities such as the area under the curve or the quantiles.
Example of multiple Kaplan-Meier survival curves:
Proportional hazards survival model (Ultimate edition)
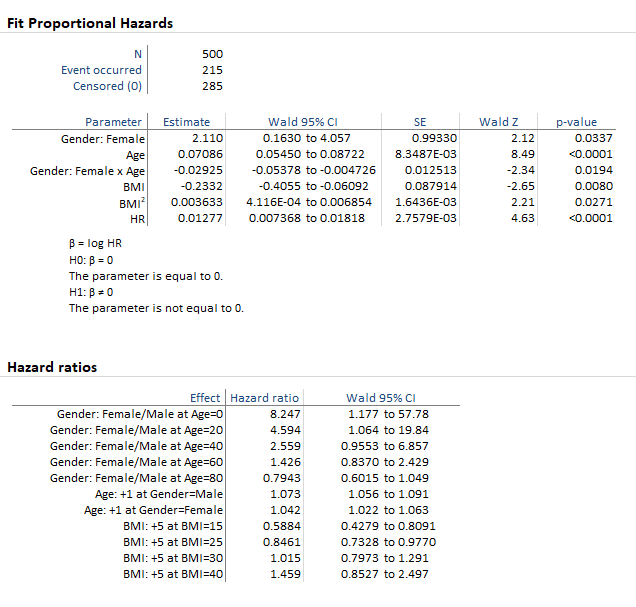
Proportional hazards model time-to-event data (survival/reliability analysis). They do not rely on estimating a survival function, but instead estimate the hazard ratios of covariates. We have added proportional hazards to the Analyse-it Fit Model analysis so you can include multiple categorical/continuous covariates and complex interaction terms. The analysis report include everything you’d expect: parameter estimates and confidence intervals, covariance matrix, likelihood ratio and Wald test of the contribution of each term, hazard ratios for each term, and the baseline survival function and plot.
Example of Cox’s proportional hazard regression using WHAS500 dataset with multiple covariates and interaction terms including estimation of complex hazard ratios:
Logistic regression improved odds ratio estimation (All editions)
The estimation of odd-ratios in Logistic regression has also been improved significantly. The new user interface lets you specify the values for covariates when they are involved in interactions, allowing you to see the effect of, for example, Gender at different Ages when the model includes an interaction such as Age x Gender.
Monoline user interface (All editions)
The latest versions of Excel now use the new monoline-style icons on all the ribbon commands for a clean, consistent user interface. We have updated Analyse-it to automatically support this look when using the later versions of Excel.
Comments
Comments are now closed.