22-Apr-2020 Diagnostic accuracy (sensitivity/specificity) versus agreement (PPA/NPA) statistics
Due to COVID-19, there is currently a lot of interest surrounding the sensitivity and specificity of a diagnostic test. These terms relate to the accuracy of a test in diagnosing an illness or condition. To calculate these statistics, the true state of the subject, whether the subject does have the illness or condition, must be known.
In recent FDA guidance for laboratories and manufacturers, “FDA Policy for Diagnostic Tests for Coronavirus Disease-2019 during Public Health Emergency”, the FDA state that users should use a clinical agreement study to establish performance characteristics (sensitivity/PPA, specificity/NPA). While the terms sensitivity/specificity are widely known and used, the terms PPA/NPA are not.
Agreement statistics
CLSI EP12: User Protocol for Evaluation of Qualitative Test Performance protocol describes the terms positive percent agreement (PPA) and negative percent agreement (NPA). When you have two binary diagnostic tests to compare, you can use an agreement study to calculate these statistics.
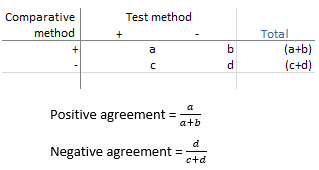
- Positive agreement is the proportion of comparative/reference method positive results in which the test method result is positive.
- Negative agreement is the proportion of comparative/reference method negative results in which the test method result is negative.
As you can see, these measures are asymmetric. That is, interchanging the test and comparative methods, and therefore the values of b and c, changes the statistics. They do, however, have a natural, simple, interpretation when one method is a reference/comparative method and the other a test method.
What agreement statistics don’t tell us
Although the formulae for positive and negative agreement are identical to those for sensitivity/specificity, it is essential to distinguish them as the interpretation is different.
We have seen product information for a COVID-19 rapid test use the terms ‘relative’ sensitivity and ‘relative’ specificity when comparing against another test. The term ‘relative’ is a misnomer. It implies that you can use these 'relative' measures to calculate the sensitivity/specificity of the new test based on the sensitivity/specificity of the comparative test. That is simply not possible.
It is also not possible, from these statistics, to determine that one test is better than another. Recently a national UK newspaper ran an article about a PCR test developed by Public Health England and the fact it disagreed with a new commercial test in 35 out of 1144 samples (3%). Of course, to many journalists, this was evidence that the PHE test was inaccurate. There is no way to know which test is correct and which incorrect in any of those 35 disagreements. We simply do not know the true state of the subject in agreement studies. Only by further investigation of those disagreements would it be possible to identify the reason for the discrepancies.
To avoid confusion, we recommend you always use the terms positive agreement (PPA) and negative agreement (NPA) when describing the agreement of such tests.
In the next blog post, we show you how to use Analyse-it to perform the agreement test with a worked example.
For more information, see our online documentation:Agreement measures for binary and semi-quantitative data
Agreement plot
Comments
Comments are now closed.