Statistics add-in software for statistical analysis in Excel

18-Aug-2014 Analyse-it 3.80 released: Principal Component Analysis (PCA)

In development Releases Statistics Using Analyse-it

Today we released version 3.80 of the Analyse-it Standard edition.

The new release includes Principal Component Analysis (PCA), an extension to the multivariate analysis already available in Analyse-it. It also includes probably the most advanced implementation of biplots available in any commercial package.

New features include:

  • Principal Components Analysis (PCA).
  • Scree plot.
  • Classical Gabriel and modern Gower & Hand biplots.
  • Covariance and Correlation monoplots.
  • Color maps for correlations and patterned matrices, based on sign and magnitude, to help identify patterns.
  • Tutorial (with video) on how to visualize the relationships between variables and similarities between observations.

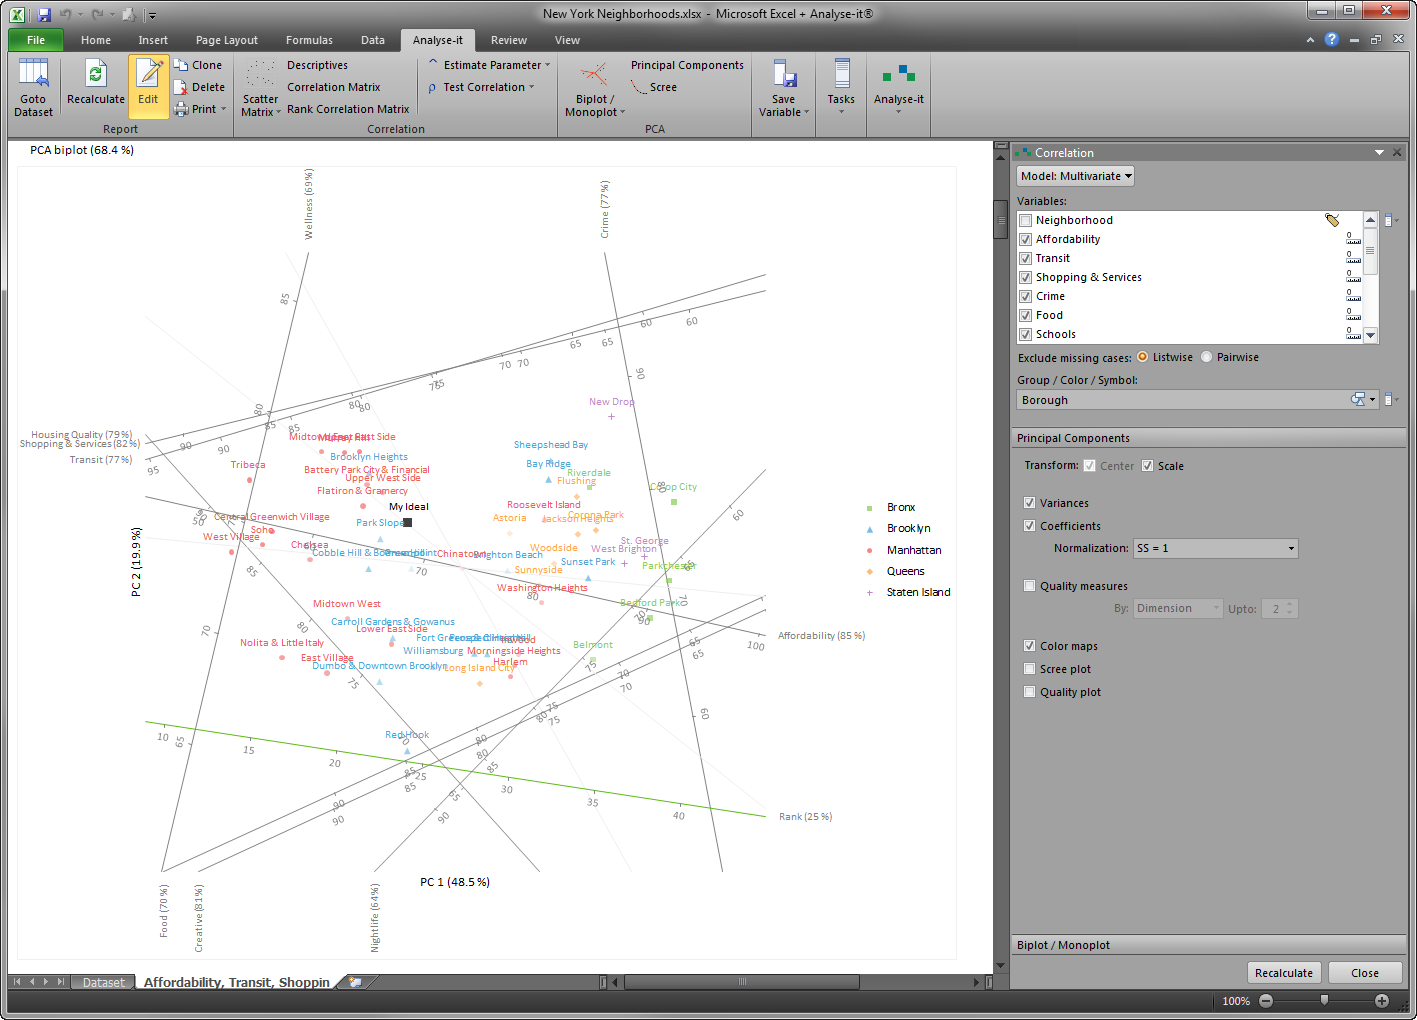
The tutorial walks you through a guided example looking at how to use correlation and principal component analysis to discover the underlying relationships in data about New York Neighbourhoods. It demonstrates the amazing new features and helps you understand how to use them. You can either follow the tutorial yourself, at your own pace, or sit back and watch the video now.

If you have active maintenance you can download and install the update now, see updating the software. If maintenance on your licence has expired you can renew it to get this update and forthcoming updates, see renew maintenance.

Previous post
Recent improvements in Analyse-it 3.76 and our first video tutorial!
Next post
A sombre note: Professor Rick Jones

Comments

Comments are now closed.

Tags
  • All (65)
  • Business (10) 
  • Case studies (2) 
  • Excel (6) 
  • In development (16) 
  • Method validation (19) 
  • Plots (2) 
  • Press releases (1) 
  • Publications (1) 
  • Releases (35) 
  • Statistics (17) 
  • Using Analyse-it (31) 
Latest posts
  • A New Year. A New Edition.
  • Analyse-it v6.10: Survival Analysis and other improvements
  • Analyse-it v5.90: Support for the updated CLSI EP6-Ed2 protocol and inverse predictions
  • Analyse-it 5.50 to 5.65: Recent improvements
  • COVID-19: Calculating the detection limit for a SARS-CoV-2 RT-PCR assay using Analyse-it
  • COVID-19: Calculating PPA/NPA agreement measures using Analyse-it
  • Diagnostic accuracy (sensitivity/specificity) versus agreement (PPA/NPA) statistics
  • COVID-19: Establishing the diagnostic accuracy (sensitivity/specificity) of a test using Analyse-it
  • Why the diagnostic test 'accuracy' statistic is useless
  • Sensitivity/Specificity and The Importance of Predictive Values for a COVID-19 test
Most popular posts
  • Announcing the Analyse-it Quality Control & Improvement Edition
  • Analyse-it 4.0 released: Support for CLSI guidelines, and Measurement Systems Analysis
  • Analyse-it 3.80 released: Principal Component Analysis (PCA)
  • Recent improvements in Analyse-it 3.76 and our first video tutorial!
  • Our software development and validation process
  • The numerical accuracy of Analyse-it against the NIST StRD
  • Quantiles, Percentiles: Why so many ways to calculate them?
  • Handbook of Parametric & Non-parametric Statistical procedures
  • A sombre note: Professor Rick Jones
statistics software, statistical software for Excel
  • Products
  • Store 
  • Support
  • Blog
  • About us
  • Download trial
  •  Search
  •  Sign in
  •  Contact us
Analyse-it editions
  • Standard edition
  • Medical edition
  • Method Validation edition
  • Quality Control & Improvement edition
  • Ultimate edition

  • Blog  
  • About us
  • Contact us  
  • Privacy policy


Copyright 2026 Analyse-it Software, Ltd, Leeds, United Kingdom .
We use essential cookies to run the site, and optional analytics to improve the experience for visitors. For more information see our Privacy policy.