Statistics add-in software for statistical analysis in Excel

13-May-2020 COVID-19: Calculating the detection limit for a SARS-CoV-2 RT-PCR assay using Analyse-it

Method validation Statistics Using Analyse-it

Recent improvements to the Analyse-it Method Validation edition, in version 5.50 and later, include the addition of probit regression. Probit regression is useful when establishing the detection limit (LoD) for an RT-qPCR assay.

The CLSI EP17-A2: Evaluation of Detection Capability for Clinical Laboratory Measurement Procedures protocol provides guidance for estimating LoD and is recognized by the FDA. In this blog post, we will look at how to perform the relevant part of the CLSI EP17-A2 protocol using Analyse-it.

For details on experimental design, see section 5.5 in the CLSI EP17-A2 guideline. In Analyse-it, you should arrange the data in 2 columns: the first should be the concentration, and the second should be the result, positive or negative. You should have a minimum of 20 replicates at each concentration. We have put together a hypothetical example in the workbook COVID-19 Detection Limit.xlsx which you can use the follow the steps below:

To Analyse-it:

  1. Select a cell in the dataset.
  2. On the Analyse-it ribbon tab, in the Statistical Analyses group, click Fit Model, and then click Probit.

    The analysis task pane opens.

  3. In the Y drop-down list, select the Result variable, and then in the Event drop-down list, select the Positive state (1).
  4. In the X drop-down list, select the RNA variable, and then click the drop-down menu icon next to the variable drop-down, and in the Transform drop-down list, select Log 10.
  5. In the Plot drop-down list, select Scaled - X against Y to show the X axis as a logarithmic scale.
  6. Clear the Individual check-box, and select the Aggregate check-box.
  7. On the Analyse-it ribbon tab, in the Fit Model group, click Predict, and then click X given Probability.
  8. On the analysis task pane, on the Fit panel, next to the Predict X given Probability, click More…, and then on the Predict X given Probability panel, click Add and select LoD=95%.

    NOTE: If using Analyse-it pre-version 5.65, on the Fit panel, in the Predict X given Probability edit box, type 0.95.

  9. Click Calculate.
  10. The analysis report shows the probit regression fit:

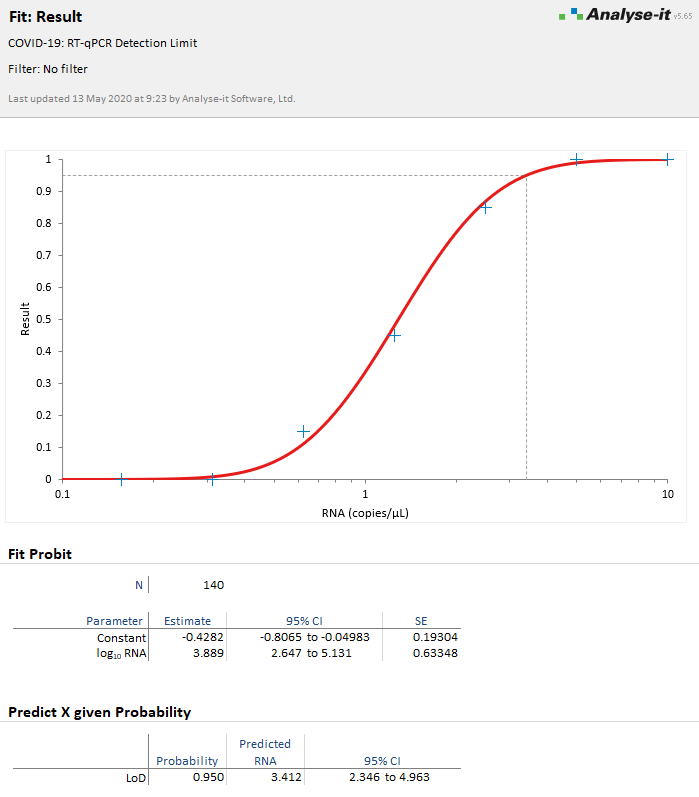
    The Predict X for given Probability section shows the limit of detection (LoD) as the point where the probability of a positive result is 95%.

    For more information, see the online documentation:
    Estimating the detection limit using a probit fit

Previous post
COVID-19: Calculating PPA/NPA agreement measures using Analyse-it
Next post
Analyse-it 5.50 to 5.65: Recent improvements

Comments

Comments are now closed.

Tags
  • All (65)
  • Business (10) 
  • Case studies (2) 
  • Excel (6) 
  • In development (16) 
  • Method validation (19) 
  • Plots (2) 
  • Press releases (1) 
  • Publications (1) 
  • Releases (35) 
  • Statistics (17) 
  • Using Analyse-it (31) 
Latest posts
  • A New Year. A New Edition.
  • Analyse-it v6.10: Survival Analysis and other improvements
  • Analyse-it v5.90: Support for the updated CLSI EP6-Ed2 protocol and inverse predictions
  • Analyse-it 5.50 to 5.65: Recent improvements
  • COVID-19: Calculating the detection limit for a SARS-CoV-2 RT-PCR assay using Analyse-it
  • COVID-19: Calculating PPA/NPA agreement measures using Analyse-it
  • Diagnostic accuracy (sensitivity/specificity) versus agreement (PPA/NPA) statistics
  • COVID-19: Establishing the diagnostic accuracy (sensitivity/specificity) of a test using Analyse-it
  • Why the diagnostic test 'accuracy' statistic is useless
  • Sensitivity/Specificity and The Importance of Predictive Values for a COVID-19 test
Most popular posts
  • Announcing the Analyse-it Quality Control & Improvement Edition
  • Analyse-it 4.0 released: Support for CLSI guidelines, and Measurement Systems Analysis
  • Analyse-it 3.80 released: Principal Component Analysis (PCA)
  • Recent improvements in Analyse-it 3.76 and our first video tutorial!
  • Our software development and validation process
  • The numerical accuracy of Analyse-it against the NIST StRD
  • Quantiles, Percentiles: Why so many ways to calculate them?
  • Handbook of Parametric & Non-parametric Statistical procedures
  • A sombre note: Professor Rick Jones
statistics software, statistical software for Excel
  • Products
  • Store 
  • Support
  • Blog
  • About us
  • Download trial
  •  Search
  •  Sign in
  •  Contact us
Analyse-it editions
  • Standard edition
  • Medical edition
  • Method Validation edition
  • Quality Control & Improvement edition
  • Ultimate edition

  • Blog  
  • About us
  • Contact us  
  • Privacy policy


Copyright 2026 Analyse-it Software, Ltd, Leeds, United Kingdom .
We use essential cookies to run the site, and optional analytics to improve the experience for visitors. For more information see our Privacy policy.