15-Apr-2020 COVID-19: Establishing the diagnostic accuracy (sensitivity/specificity) of a test using Analyse-it
It is important in diagnostic accuracy studies that the true clinical state of the patient is known. For example, in developing a SARS-CoV-2 anti-body test, for the positive subgroup, you might enlist subjects who had a positive SARS-CoV-2 PCR test and clinically confirmed illness. Then, for the negative subgroup, you might use samples taken from subjects before the illness was in circulation. It is also essential to consider other factors, such as the severity of illness, as they can have a marked effect on the performance characteristics of the test. A test that shows high sensitivity/specificity in a hospital situation in very ill patients can be much less effective in population screening where the severity of the illness is less.
In cases where the true condition of the subject is not known, and only results from a comparative method and a new test method are available, an agreement measure is more suitable. We will cover that scenario in detail in a future blog post.
Statistical analysis of diagnostic test study data
In Analyse-it, there are two ways to arrange your data for this analysis.
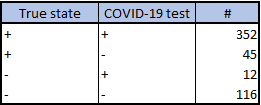
Frequency form data summarizes the frequency counts for each combination of true state, test result:
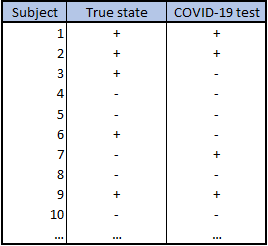
Case form data lists the individual true state and test result for each subject:
You can find examples of both, and follow along with the steps below, using the workbook COVID-19 Diagnostic Accuracy Example.xlsx
To Analyse-it:
- Select a cell in the dataset.
- On the Analyse-it ribbon tab, in the Statistical Analyses group, click Diagnostic, and then click Binary (Sensitivity / Specificity).
The analysis task pane opens. - In the True state drop-down list, select the true state variable.
- In the Positive event drop-down list, select the state that indicates the presence of the condition of interest.
- In the Y drop-down list, select the test variable.
- In the Positive event drop-down list, select the state that indicates a positive test.
- If the data are in frequency form, in the Frequency drop-down list, select the frequency variable containing the counts.
- Select the required statistics Sensitivity/Specificity, Likelihood ratios.
NOTE: Hover the mouse pointer over an option to see a context-sensitive help pop-up with more information and notes on when to use it. - Click Calculate.
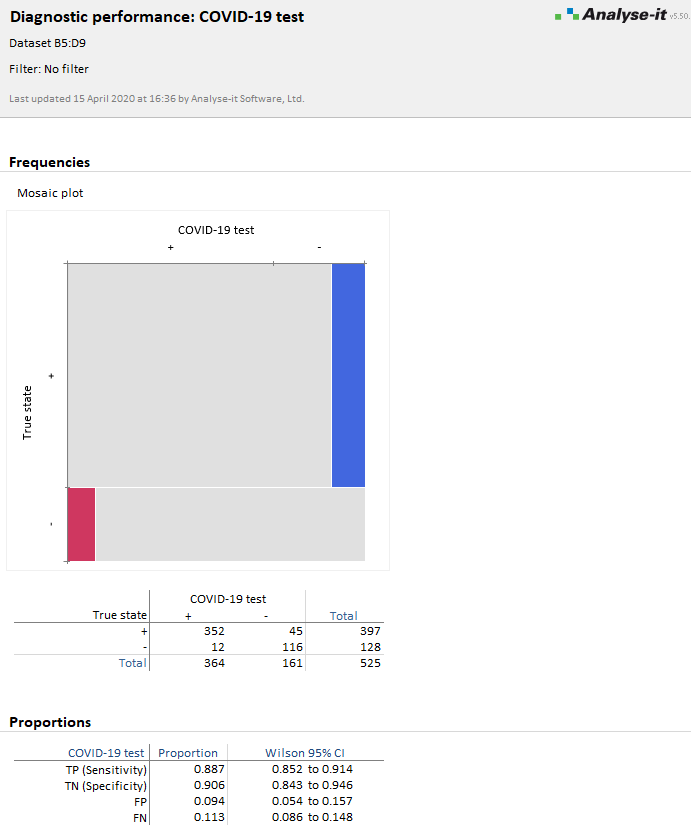
The analysis report shows the sensitivity/specificity and other statistics.
To compute the predictive values given the prevalence of illness in a population:
- On the Analyse-it task ribbon tab, in the Diagnostic Accuracy group, click Predictive values.
The analysis task pane opens, and the Predictive value checkbox is selected. - In the Prior probability edit box, type the prevalence. If you have more than one scenario, click the More button, and then in the Prior probabilities grid, type the prevalences and optional scenario names.
- Click Recalculate.
If you have any questions about using the Analyse-it Method Validation edition for diagnostic accuracy studies, please contact us.
For more information, see our online documentation:
Measures of diagnostic accuracy
Estimating the sensitivity and specificity of a binary test
Comments
Comments are now closed.