Statistics add-in software for statistical analysis in Excel
  • Statistical Reference Guide
  • Method comparison / Agreement

Agreement measures for binary and semi-quantitative data

Agreement measures summarize the similarity of the results of two binary or semi-quantitative methods.

Asymmetric agreement measures are dependent on the assignment of X and Y variables. They are often useful due to the natural interpretation as the proportion of the comparative method (X) results in which the new method (Y) results are the same.

For a binary test, with positive/negative results, the results can be expressed as a 2x2 contingency table:

The positive agreement (PPA) and negative agreement (NPA) have a natural interpretation:
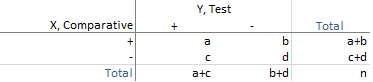
  • Positive agreement is the proportion of comparative/reference method positive results in which the test method result is positive.

  • Negative agreement is the proportion of comparative/reference method negative results in which the test method result is negative.

Symmetric agreement measures are not affected by interchanging the X and Y variable. These are useful in many other cases, such as comparing observers, laboratories, or other factors where neither is a natural comparator. There are various measures based on the mean of the proportions to which X agrees with Y, and Y agrees with X. The Kulczynski, Dice-Sørensen, and Ochiai are three such measures that use arithmetic, harmonic, and geometric mean of the proportions, respectively.

The harmonic mean weights the smaller proportion more heavily and produces the smallest value amongst the three measures. The geometric mean is the square root of Bangdiwala’s B statistic, which is the ratio of the observed agreement to maximum possible agreement in the agreement plot. The arithmetic mean has the greatest value. In most cases, of moderate to high agreement, there is very little to choose between the measures.

The average positive agreement and average negative agreement using the Dice-Sørensen measure are:
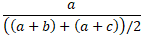
  • Average positive agreement is the number of positive matches as a proportion of the average of the number of positive results by X, Y.

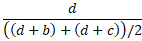
  • Average negative agreement is the number of negative matches as a proportion of the average of the number of negative results by X, Y.

The overall proportion of agreement is the sum of the diagonal entries divided by the total.

Related concepts
Agreement plot
Chance corrected agreement measures for binary and semi-quantitative data
Related tasks
Estimating agreement between two binary or semi-quantitative methods
Related information
Warrens, M. J. (2019). Similarity measures for 2× 2 tables. Journal of Intelligent & Fuzzy Systems, 36(4), 3005-3018.
Available in Analyse-it Editions
Method Validation edition
Ultimate edition

  •  What is Analyse-it?
  •  What's new?
  •  Administrator's Guide
  •  User's Guide
  •  Statistical Reference Guide
  •  Distribution
  •  Compare groups
  •  Compare pairs
  •  Contingency tables
  •  Correlation and association
  •  Principal component analysis (PCA)
  •  Factor analysis (FA)
  •  Item reliability
  •  Fit model
  •  Method comparison / Agreement
  •  Correlation coefficient
  •  Scatter plot
  •  Fit Y on X
  •  Fitting ordinary linear regression
  •  Fitting Deming regression
  •  Fitting Passing-Bablok regression
  •  Linearity
  •  Residual plot
  •  Checking the assumptions of the fit
  •  Average bias
  •  Estimating the bias between methods at a decision level
  •  Testing commutability of other materials
  •  Difference plot (Bland-Altman plot)
  •  Fit differences
  •  Plotting a difference plot and estimating the average bias
  •  Limits of agreement (LoA)
  •  Plotting the Bland-Altman limits of agreement
  •  Mountain plot (folded CDF plot)
  •  Plotting a mountain plot
  •  Partitioning and reducing the measuring interval
  •  Agreement measures for binary and semi-quantitative data
  •  Chance corrected agreement measures for binary and semi-quantitative data
  •  Agreement plot
  •  Estimating agreement between two binary or semi-quantitative methods
  •  Study design
  •  Study design for qualitative methods
  •  Measurement systems analysis (MSA)
  •  Reference interval
  •  Diagnostic performance
  •  Survival/Reliability
  •  Control charts
  •  Process capability
  •  Pareto analysis
  •  Study Designs
  •  Bibliography


Version 6.15
Published 18-Apr-2023
statistics software, statistical software for Excel
  • Products
  • Store 
  • Support
  • Blog
  • About us
  • Download trial
  •  Search
  •  Sign in
  •  Contact us
Analyse-it editions
  • Standard edition
  • Medical edition
  • Method Validation edition
  • Quality Control & Improvement edition
  • Ultimate edition

  • Blog  
  • About us
  • Contact us  
  • Privacy policy


Copyright 2026 Analyse-it Software, Ltd, Leeds, United Kingdom .
We use essential cookies to run the site, and optional analytics to improve the experience for visitors. For more information see our Privacy policy.