14-Oct-2013 Analyse-it Method Validation edition version 3.5 is now available
Today we released the Analyse-it Method Validation edition version 3.5. The software is feature complete, validated, and includes documentation. It supports Excel 2007, Excel 2010 (32- and 64-bit) and Excel 2013 (32- and 64-bit).
We took this opportunity to rename the product from the Analyse-it Method Evaluation edition to the Method Validation edition. The product is the same, but the new name better reflects the intended purpose of the product.
New features include:
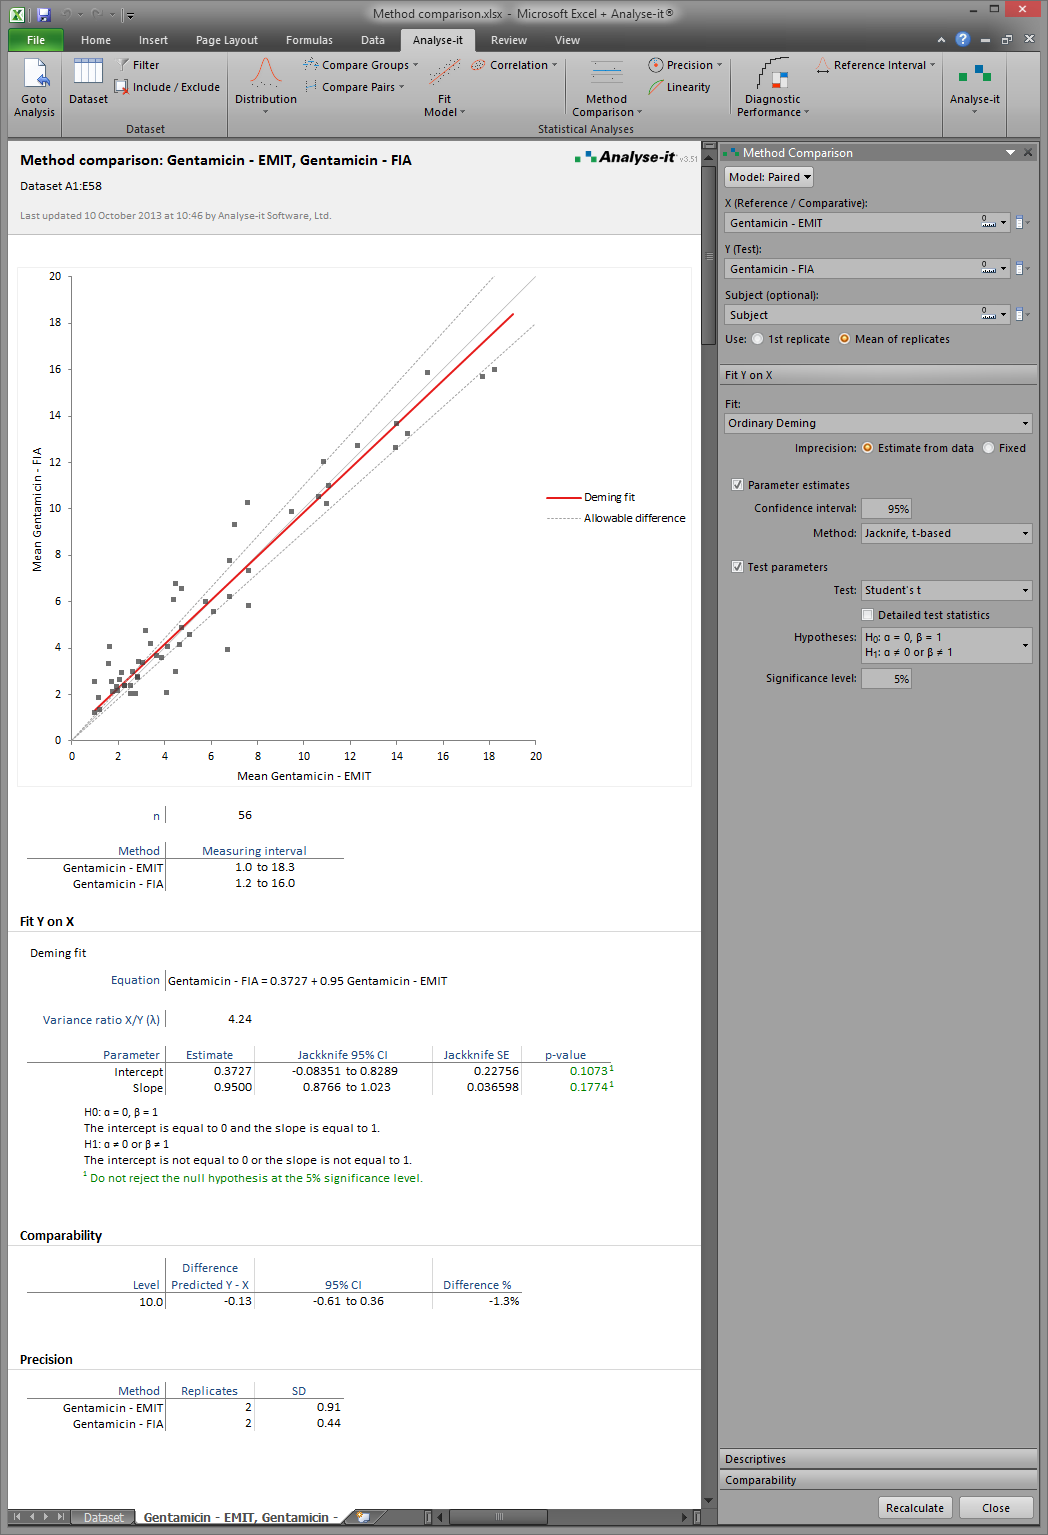
Method Comparison
- All method comparison functions: scatters plots, difference plots, and fits, are now in one place so it’s easy to make decisions or choose fits after looking at the data.
- Ordinary linear, Weighted linear, Ordinary Deming, Weighted Deming and Passing & Bablok regressions.
- Constant difference and relative difference plots with mean difference, allowable difference, and limits of agreement.
- Bootstrap confidence intervals for parameters and bias in Passing & Bablok regression.
- Exact p-values on CUSUM linearity test.
- Predict mean difference at decision levels.
- Equality and equivalence hypothesis tests at decision levels.
- Kappa and Weighted Kappa qualitative method comparison.
Precision
- Graybill-Wang / Ting-Burdick-Graybill-Jeyaratnam-Lu modified large sample confidence interval estimators for variance components – produces confidence closer to the stated level than Satterthwaite confidence intervals, which can be too liberal.
- Support for unbalanced 1- and 2-factor nested random ANOVA models, for looking at precision between days, runs, laboratories, etc.
Linearity
- Hsieh-Liu confidence interval estimator for degree of nonlinearity.
- Equality and equivalence hypothesis tests for nonlinearity.
Reference interval
- Harrell-Davis, Bootstrap, and Robust Bi-weight quantiles.
- Box-Cox and other transformations.
Diagnostic performance / ROC
- Compare up to 10 independent or correlated ROC curves.
- Equality, equivalence and non-inferiority hypothesis tests.
- Estimate false positive fraction (FPF) at fixed sensitivity, sensitivity at fixed FPF, and sensitivity/FPF at fixed cut-off.
- Find optimal decision threshold based on costs.
Binary diagnostic tests
- Compare sensitivity and specificity of 2 independent or correlated tests.
- Diagnostic odds-ratio and Youden’s index.
- Improved confidence interval estimators for likelihood ratio and predictive values.
For more information about the new version, and to download a free 30-day trial, see:
Pricing for the Analyse-it Method Validation edition starts at US$ 699 for a 1-user perpetual licence. If you already have a licence you may qualify for a free upgrade, if you have active maintenance, otherwise you can extend maintenance to get the upgrade (and all updates for 1- or 3-years) free of charge. To see if you qualify for a free upgrade, otherwise get a quote to extend maintenance, see:
Comments
Comments are now closed.