Analyse-it
Analyse-it
  • Products
  • Pricing
  • Support
  • About us
Download trial Sign in
  • Statistical Reference Guide
  • Distribution
  • Continuous distributions
  • Frequency distribution

Histogram

A histogram shows the distribution of the data to assess the central tendency, variability, and shape.


frequency histogram

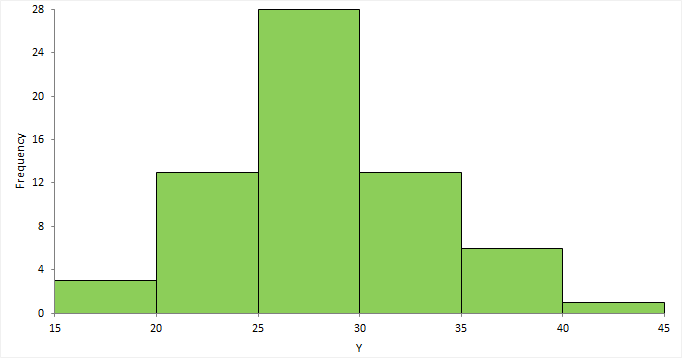
A histogram for a quantitative variable divides the range of the values into discrete classes, and then counts the number of observations falling into each class interval. The area of each bar in the histogram is proportional to the frequency in the class. When the class widths are equal, the height of the bar is also proportional to the frequency in the class.

Choosing the number of classes to use can be difficult as there is no "best," and different class widths can reveal or hide features of the data. Scott's and Freedman-Diaconis' rules provide a default starting point, though sometimes particular class intervals make sense for a particular problem.

The histogram reveals if the distribution of the data is normal, skewed (shifted to the left or right), bimodal (has more than one peak) and so on. Skewed data can sometimes be transformed to normal using a transformation. Bi-modality often indicates that there is more than one underlying population in the data. Individual bars distanced from the bulk of the data can indicate the presence of an outlier.

Related concepts
Frequency table
Related tasks
Creating a histogram
Available in Analyse-it Editions
Standard edition
Method Validation edition
Quality Control & Improvement edition
Ultimate edition

  •  What is Analyse-it?
  •  What's new?
  •  Administrator's Guide
  •  User's Guide
  •  Statistical Reference Guide
  •  Distribution
  •  Continuous distributions
  •  Univariate descriptive statistics
  •  Calculating univariate descriptive statistics
  •  Univariate plot
  •  Creating a univariate plot
  •  Frequency distribution
  •  Cumulative distribution function plot
  •  Creating a CDF plot
  •  Histogram
  •  Creating a histogram
  •  Normality
  •  Inferences about distribution parameters
  •  Discrete distributions
  •  Study design
  •  Compare groups
  •  Compare pairs
  •  Contingency tables
  •  Correlation and association
  •  Principal component analysis (PCA)
  •  Factor analysis (FA)
  •  Item reliability
  •  Fit model
  •  Method comparison / Agreement
  •  Measurement systems analysis (MSA)
  •  Reference interval
  •  Diagnostic performance
  •  Survival/Reliability
  •  Control charts
  •  Process capability
  •  Pareto analysis
  •  Study Designs
  •  Bibliography


Version 6.15
Published 18-Apr-2023
Products
  • Standard Edition
  • Medical Edition
  • Quality Control & Improvement Edition
  • Method Validation Edition
  • Ultimate Edition
  • Compare Editions
  • Pricing
Support
  • Documentation
  • Tutorials
  • Download latest version
  • Release history
  • Contact support
Company
  • About us
  • Blog
  • Contact us
  • Privacy policy

Get Started

  • Download free trial
  • Sign In

© 2026 Analyse-it® Software, Ltd. All rights reserved.

Statistical analysis and method validation software for Microsoft Excel.

We use essential cookies to run the site, and optional analytics to improve the experience for visitors. For more information see our Privacy policy.