Statistics add-in software for statistical analysis in Excel
  • Statistical Reference Guide
  • Method comparison / Agreement

Mountain plot (folded CDF plot)

A mountain plot shows the distribution of the differences between two methods. It is a complementary plot to the difference plot.


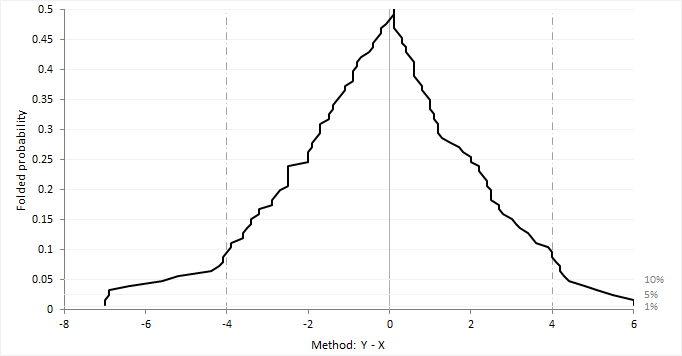
Krouwer and Monti (1995) devised the mountain plot (also known as a folded empirical cumulative distribution plot) as a complementary representation of the difference plot. It shows the distribution of the differences with an emphasis on the center and the tails of the distribution. You can use the plot to estimate the median of the differences, the central 95% interval, the range, and the percentage of observations outside the total allowable error bands.

The plot is simply the empirical cumulative distribution function of the differences folded around the median (that is, the plotted function = p where p < 0.5 otherwise 1-p). Unlike the histogram it is unaffected by choice of class intervals, however it should be noted that although the mountain plot looks like a frequency polygon it does not display the density function. It has recently been proven that the area under the plot is equal to the mean absolute deviation from the median (Xue and Titterington, 2010).

Related tasks
Plotting a mountain plot
Related information
Krouwer, J. S., & Monti, K. L. (1995). A simple, graphical method to evaluate laboratory assays. European journal of clinical chemistry and clinical biochemistry, 33(8), 525-528.
Monti, K. L. (1995). Folded empirical distribution function curves—mountain plots. The American Statistician, 49(4), 342-345.
Xue J., Titterington D. M. (2010, unpublished). The p-folded Cumulative Distribution Function and the Mean Absolute Deviation from the p-quantile.
Available in Analyse-it Editions
Method Validation edition
Ultimate edition

  •  What is Analyse-it?
  •  What's new?
  •  Administrator's Guide
  •  User's Guide
  •  Statistical Reference Guide
  •  Distribution
  •  Compare groups
  •  Compare pairs
  •  Contingency tables
  •  Correlation and association
  •  Principal component analysis (PCA)
  •  Factor analysis (FA)
  •  Item reliability
  •  Fit model
  •  Method comparison / Agreement
  •  Correlation coefficient
  •  Scatter plot
  •  Fit Y on X
  •  Fitting ordinary linear regression
  •  Fitting Deming regression
  •  Fitting Passing-Bablok regression
  •  Linearity
  •  Residual plot
  •  Checking the assumptions of the fit
  •  Average bias
  •  Estimating the bias between methods at a decision level
  •  Testing commutability of other materials
  •  Difference plot (Bland-Altman plot)
  •  Fit differences
  •  Plotting a difference plot and estimating the average bias
  •  Limits of agreement (LoA)
  •  Plotting the Bland-Altman limits of agreement
  •  Mountain plot (folded CDF plot)
  •  Plotting a mountain plot
  •  Partitioning and reducing the measuring interval
  •  Agreement measures for binary and semi-quantitative data
  •  Chance corrected agreement measures for binary and semi-quantitative data
  •  Agreement plot
  •  Estimating agreement between two binary or semi-quantitative methods
  •  Study design
  •  Study design for qualitative methods
  •  Measurement systems analysis (MSA)
  •  Reference interval
  •  Diagnostic performance
  •  Survival/Reliability
  •  Control charts
  •  Process capability
  •  Pareto analysis
  •  Study Designs
  •  Bibliography


Version 6.15
Published 18-Apr-2023
statistics software, statistical software for Excel
  • Products
  • Store 
  • Support
  • Blog
  • About us
  • Download trial
  •  Search
  •  Sign in
  •  Contact us
Analyse-it editions
  • Standard edition
  • Medical edition
  • Method Validation edition
  • Quality Control & Improvement edition
  • Ultimate edition

  • Blog  
  • About us
  • Contact us  
  • Privacy policy


Copyright 2026 Analyse-it Software, Ltd, Leeds, United Kingdom .
We use essential cookies to run the site, and optional analytics to improve the experience for visitors. For more information see our Privacy policy.