
The bias at a medical decision point is the difference between two methods at the concentration where a clinical decision is made, estimated from a method comparison. A method comparison produces a slope and an intercept, and it is tempting to treat those as the answer. Slope and intercept describe the relationship across the whole range, but a clinician, a reviewer or an auditor needs something narrower.
The narrower question is how far apart the two methods are at the concentration where a decision gets made, and whether that gap could change the decision. The bias at the decision point answers both, and it is the number a method comparison exists to deliver.
Average agreement can hide trouble exactly where it matters. A method can sit almost on top of its comparator across most of the range and still diverge at one particular concentration. If a clinical threshold happens to fall there, that local bias is what moves patients across the threshold, in either direction.
A medical decision point is a concentration where clinical action changes: a diagnostic cut-off, a treatment threshold, an alert level. The bias that matters is the bias at those points, not the bias averaged over a range that mostly lies where no decision is made.
Fit an appropriate regression to the comparison data: Deming or Passing–Bablok rather than ordinary least squares, for the reasons that guide covers. Then use it to predict, at each decision point, what the new method reads when the comparative method reads the decision value. The difference between the two is the estimated bias at that point.
Both the constant offset (the intercept) and the proportional bias (the slope) feed into the bias. The bias at a low decision point can therefore differ substantially from the bias at a high one. Estimate it point by point rather than reading a single average.
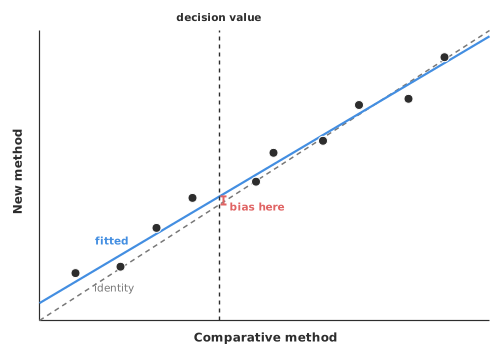
The estimated bias is a prediction from a fitted line, so it carries the line’s uncertainty. The uncertainty varies along the range, typically tightest near the centre of the data and wider towards the extremes.
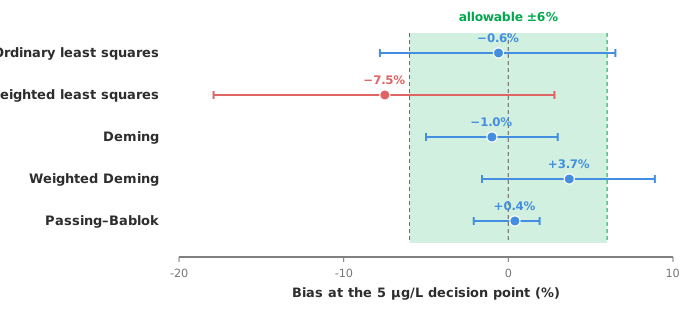
Report the bias at each decision point with its confidence interval. Against an allowable bias of ±8%, a bias of 4% with an interval of 2–6% supports a firm conclusion that the bias is acceptable. The same 4% with an interval of −3% to 11% does not, because the interval runs past the limit. Quoting the point estimate alone hides the difference between these two cases.
An estimated bias means nothing until it is compared against how much bias is tolerable at that decision point. The allowable bias comes from outside the comparison: from biological variation, from regulatory limits, or from clinical judgement about how much change would alter management. With a limit in hand, the question becomes a proper test: does the whole confidence interval for the bias lie inside the allowable limits?
An equivalence framing is appropriate here. You are trying to show the methods are close enough to be interchangeable, not just failing to prove they differ. A wide confidence interval that happens to straddle zero is not evidence of equivalence; it is evidence of an underpowered study, which is a different finding entirely.
The workbook below fits five method-comparison regressions to the same data. Each reports the bias at a medical decision point of 5 µg/L with a confidence interval, and all but Passing–Bablok add a hypothesis test. Comparing the decision-point bias across the fits is instructive in itself. Where the five fits agree, the bias estimate is robust. Where they diverge, the choice of regression affects the result and deserves scrutiny.
Download the CLSI EP09-A3 method comparison example workbook (.xlsx) — five regression fits, each with the bias at a 5 µg/L decision point and its confidence interval, ready to open in the Analyse-it trial.
The example workbook is downloading.
It opens in Excel on its own — the data and the finished results are both in it. Analyse-it is what lets you change the analysis and re-run it, try the same study on your own data, or work through it to see how the software handles it.
Every feature from all five editions for 15 days.
Reporting the slope and intercept and stopping there. They are a step towards the answer, not the answer. Translate them into the bias at the decision points that drive clinical action.
Quoting one average bias for the whole range. Bias can differ at low and high decision points. Estimate it at each one.
Dropping the confidence interval. The decision-point bias is a prediction with uncertainty that widens towards the extremes. Report the interval, not just the estimate.
Reading “not significantly different” as equivalent. A wide interval that includes zero means underpowered, not interchangeable. Test against an allowable bias, not against zero.
Analyse-it estimates the bias where it matters clinically, from your own comparison data, inside Excel:
Every feature from all five editions for 15 days. Bias at decision points, and the regression fits it is estimated from, are in the Method Validation and Ultimate editions, from US$ 475 a year. The Medical edition, from US$ 340 a year, has Bland–Altman agreement but not bias at decision points. Validated against NIST and CLSI reference datasets. See also choosing a regression.