
“Which test should I use?” is a question that derails many analyses. The question is usually asked too late, after the data are collected, when the design has already fixed most of the answer. Choosing a test is not really a menu problem either. Three properties narrow the field to one or two candidates: what you are asking, what kind of measurement you have and whether the observations are independent or paired.
Statistical tests answer a small number of recurring questions. Naming yours precisely is most of the work. Are you asking whether one sample differs from a known or target value? Whether two or more groups differ from each other? Whether two things move together? Whether one variable predicts another? Or whether two categorical classifications are related?
None of those is “is my result significant?” Significance is the output, not the question. Starting there is how people end up running a test that answers something they did not ask. Several of these questions are better answered with an estimate and an interval than with a test at all. Settle that before you pick a test; see confidence intervals and p-values.
A continuous measurement (a concentration, a mass, a time) supports tests about means and the parametric toolkit. An ordinal measurement supports tests on ranks but not on means. Think of a five-point severity score: the order is meaningful but the spacing is not. The arithmetic mean of such a scale is therefore not really a quantity that exists. A categorical measurement (positive or negative, one of four species) supports tests on counts and proportions instead, which is a different family entirely.
Matching the test to the measurement scale is the step people skip, and skipping it produces the most confidently wrong analyses. Averaging a single Likert item and running a t-test on it is the classic case. The software will happily return a p-value, because arithmetic does not know what the numbers actually mean.
Are the two sets of numbers measured on different subjects, or on the same subjects twice? Independent groups (a treated group and a control group, different patients in each) call for an independent-samples test. Paired observations (before and after on the same subject, two methods run on the same specimen, matched case-control pairs) call for a paired test.
The independent-or-paired question matters more than it first looks. A paired test works on the differences within each pair, which removes between-subject variation from the comparison. When subjects vary a lot from each other but each one responds consistently, pairing can turn a study that needs hundreds of subjects into one that needs dozens. Treat paired data as independent and you throw that gain away, often missing a real effect. Treat independent data as paired and the analysis is invalid: there are no genuine pairs to difference.
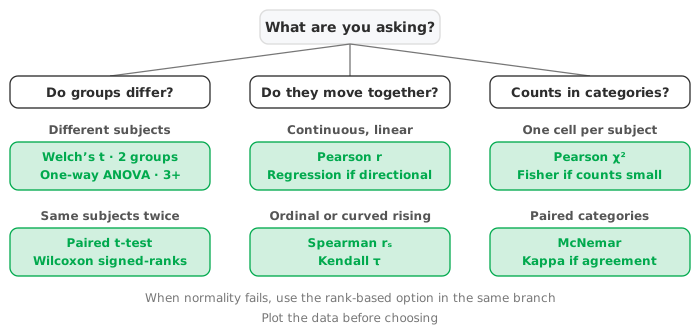
For two independent groups of continuous data, the usual choice is a t-test, and Welch’s version is the better default. Welch’s t-test does not assume equal variances and costs almost nothing when they happen to be equal. The reasoning is set out in Student’s, Welch’s or paired. When normality is doubtful, the Wilcoxon-Mann-Whitney test compares the distributions through ranks instead.
For two paired groups, the paired t-test analyses the within-pair differences. The Wilcoxon signed-ranks test and the sign test are the non-parametric alternatives.
For three or more independent groups, one-way ANOVA generalises the t-test, with Welch’s ANOVA for unequal variances and Kruskal-Wallis as the rank-based option. If you have more than one factor, or a covariate to adjust for, you have left the one-way case behind and want multi-factor ANOVA or ANCOVA. A significant ANOVA will not tell you which groups differ. For that you need a multiple comparison procedure, chosen to match the comparisons you actually care about.
If the question is whether two continuous variables move together, that is correlation. Use Pearson for a linear relationship, and Spearman or Kendall for a monotonic one or for ordinal data, as covered in Pearson, Spearman or Kendall. If the question is how one variable depends on another, or how to predict it, that is regression. Use multiple regression for a continuous outcome, and logistic regression for a yes/no one.
Correlation is symmetric and describes strength of association. Regression is directional and describes the form of the relationship. You need regression if you want to predict, adjust for a confounder, or state an effect per unit. In one specific case, comparing two measurement methods, correlation is not just different but actively misleading, for reasons in why correlation is the wrong statistic for method comparison.
Counts in a table are their own family. For a general r × c table, the Pearson χ² test asks whether the classifications are independent. For a 2 × 2 table with small expected counts, Fisher’s exact test is the safer choice. For a 2 × 2 table of paired classifications (the same subjects assessed twice), McNemar’s test is the right one, for the same independent-versus-paired reason as above. Chi-square, Fisher exact or McNemar walks through the choice.
Every parametric test assumes something. For the group-comparison family, the two that matter most are approximate normality and, for Student’s t and classical ANOVA, roughly equal variances. Both deserve a look, and both are routinely mishandled.
A formal normality test on a large sample rejects trivial departures that would never have troubled the t-test. On a small sample it has too little power to catch the departures that actually would. Testing normality, and what to do when it fails covers what to look at instead, and what your options are when the assumption does not hold.
One assumption gets less attention than it should: independence of the observations themselves. Three measurements from each of ten subjects are not thirty independent observations, and none of these tests will notice if you treat them as though they were. Independence is a design question, so answer it with the structure of the analysis (a repeated-measures model, or a summary per subject), not by which test you pick.
Download the compare-groups example workbook (.xlsx) — calcium supplementation and blood pressure in two independent groups, with box plots, a Fisher F test for the variance ratio and Student’s t-test, ready to open in the Analyse-it trial. The example screens the variances before running Student’s t, so rerun it with Welch’s t-test and compare the results.
The example workbook is downloading.
It opens in Excel on its own — the data and the finished results are both in it. Analyse-it is what lets you change the analysis and re-run it, try the same study on your own data, or work through it to see how the software handles it.
Every feature from all five editions for 15 days.
Choosing the test after seeing the data. Running several and reporting the one that reached significance inflates the error rate in a way no correction can repair. Decide from the design instead.
Treating paired data as independent. The pairing is information, and discarding it usually costs power, which is a common way for a real effect to be missed.
Testing means on ordinal scales. If the spacing between categories is not meaningful, neither is the average. Use rank-based methods instead.
Screening with a normality test and switching on the result. Choosing between a parametric and a non-parametric test based on a preliminary test distorts the properties of whichever one you end up running.
Stopping at the p-value. A test says whether an effect is distinguishable from noise. It does not say how big it is or whether it matters. Report the estimate and its interval alongside it.
Analyse-it organises the methods as tasks rather than a list of functions, inside Excel:
Every feature from all five editions for 15 days. Hypothesis testing is part of the Standard edition, so it is in every Analyse-it edition, from US$ 155 a year. Validated against NIST Standard Reference Datasets.