Statistical software for biomedical and clinical research Survival curves, diagnostic accuracy, agreement and reference intervals — produced to the standard a reviewer expects, in a workbook a co-author can open without a licence.

Every feature from all five editions for 15 days, no sign-up.
Medical edition from US$ 340 a year · 30-day money-back guarantee.
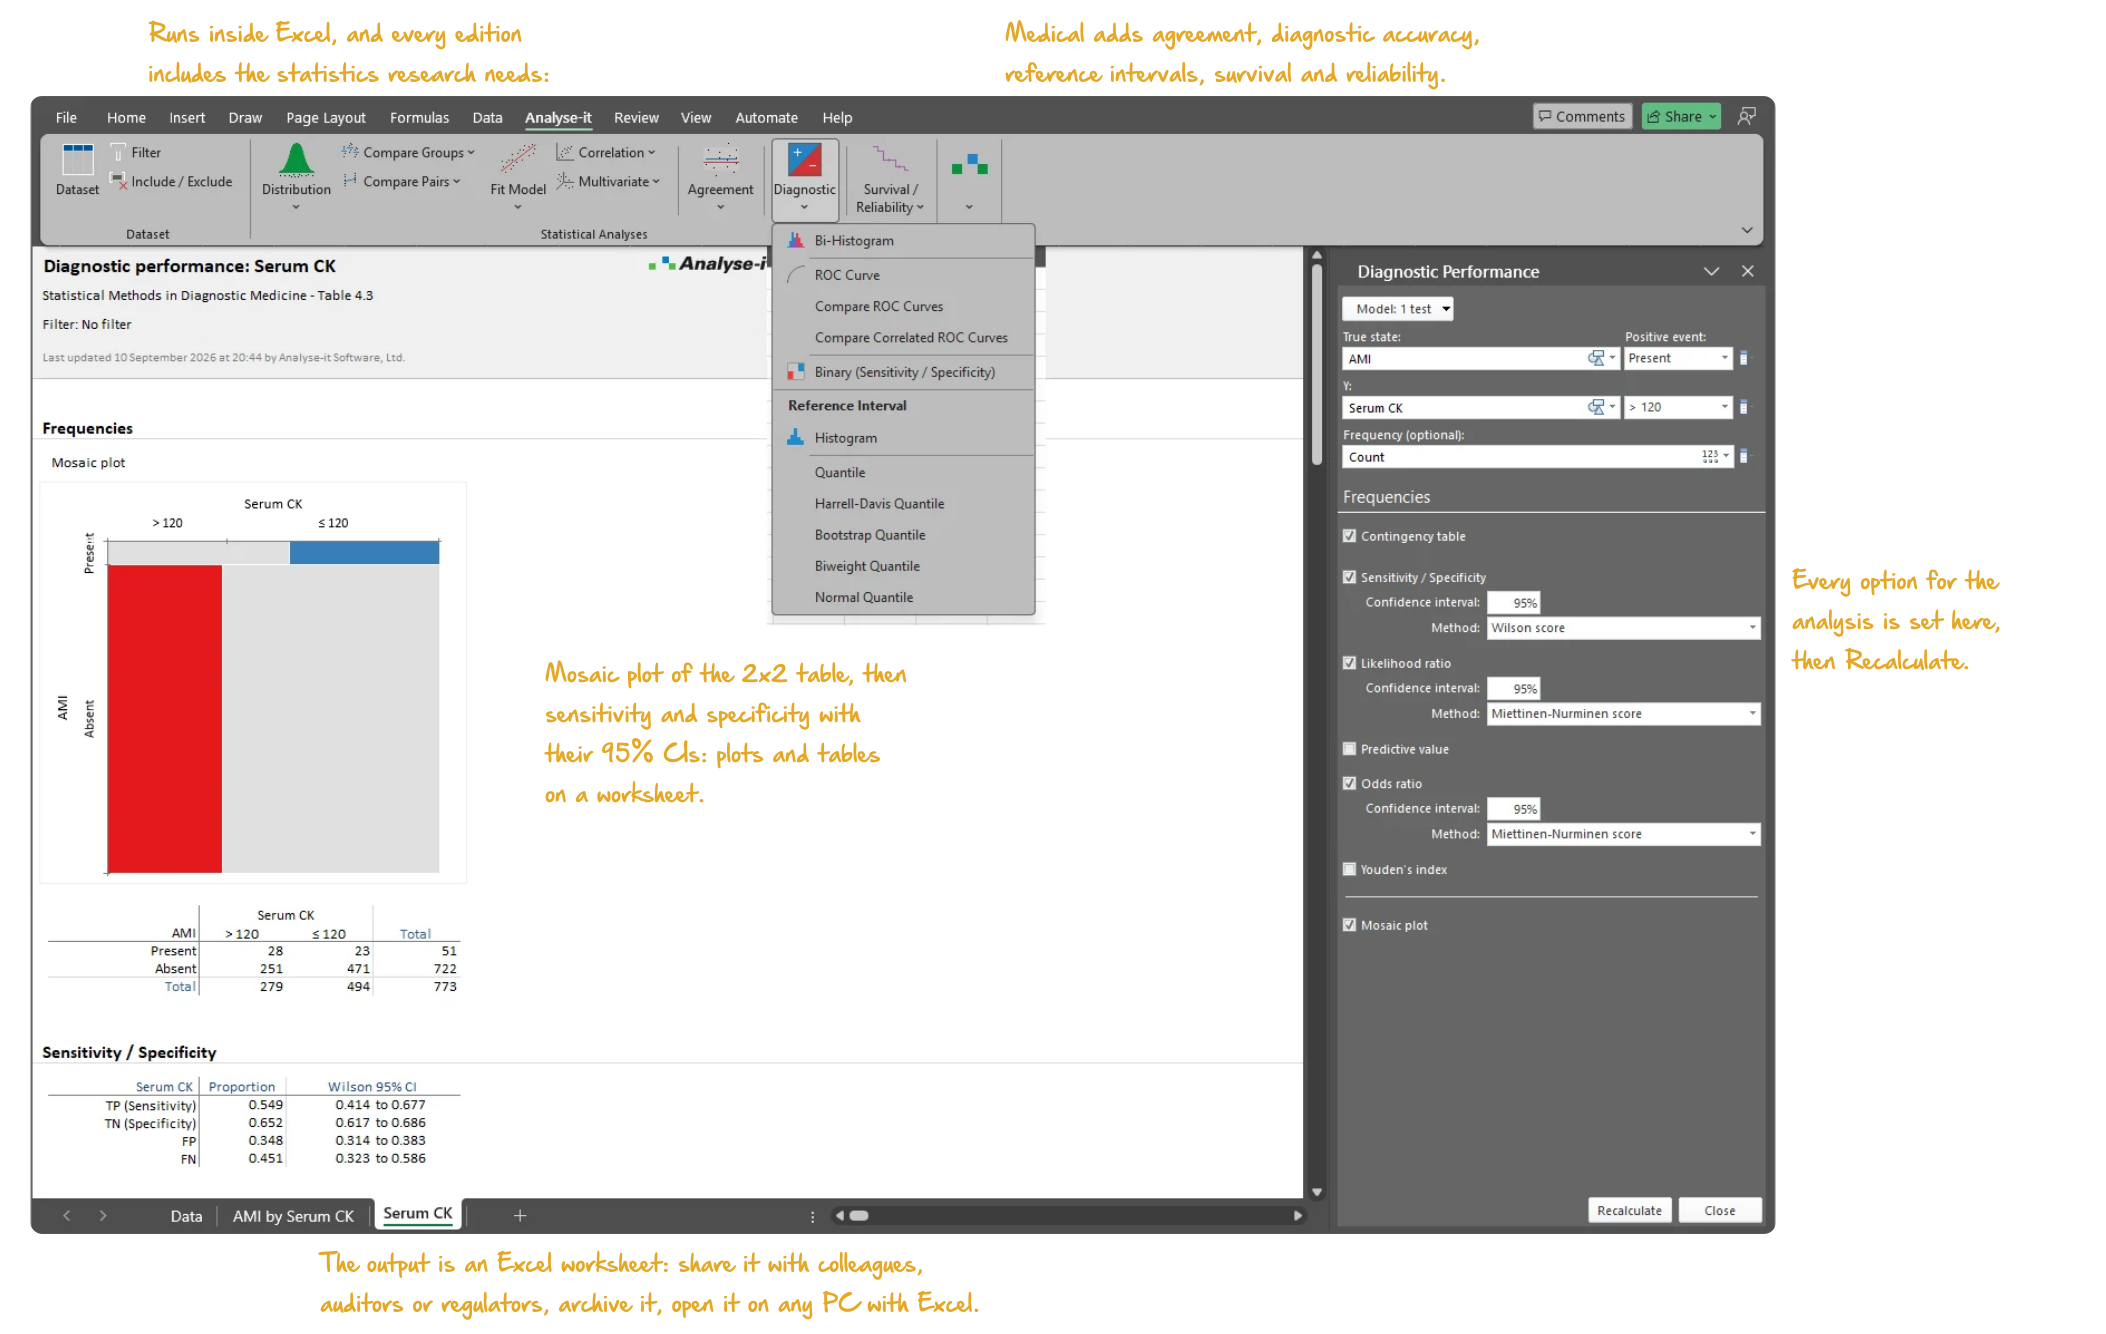
Microsoft Excel with the Analyse-it tab of the Medical edition selected: a diagnostic performance report for serum CK with the mosaic plot of the 2x2 table, the frequencies and the sensitivity and specificity table with confidence intervals, the Diagnostic Performance task pane open, and the Diagnostic menu dropped open on the ribbon listing the ROC, binary and reference interval commands. Handwritten notes: Runs inside Excel, and every edition includes the statistics research needs:; Medical adds agreement, diagnostic accuracy, reference intervals, survival and reliability; Mosaic plot of the 2x2 table, then sensitivity and specificity with their 95% CIs: plots and tables on a worksheet; Every option for the analysis is set here, then Recalculate; The output is an Excel worksheet: share it with colleagues, auditors or regulators, archive it, open it on any PC with Excel.
Analyse-it has helped tremendously. Previously I used Prism and Microsoft Excel, but Analyse-it has made my life so much easier and saved so much time.
Man Khun Chan, M.Sc., ART
Test Development Medical Technologist
The Hospital For Sick Children, Toronto, Canada

Clinical and biomedical work asks a narrow set of statistical questions repeatedly. Does the marker separate the two groups, and by how much? Do the two measurement methods agree closely enough to be used interchangeably? What is the normal range in this population? How long until the event, and does the treatment change that?

General statistics packages answer the last of those well and the first three awkwardly, usually by leaving you to assemble the analysis from parts. Analyse-it runs each of them as a single analysis inside Excel, with the confidence intervals and the comparisons a reviewer asks for already in the output.

Trusted for nearly 30 years by 75,000 scientists in clinical, research and quality control laboratories.

Mayo Clinic Roche Memorial Sloan Kettering Cancer Center Siemens Healthineers CHUV Lausanne University Hospital Sysmex Odense University Hospital North Dakota Department of Health

Survival analysis: Kaplan–Meier, log-rank and Cox

Time-to-event work is the analysis most often exported to another package, and the export is where the errors start. Censoring gets recoded by hand, groups are relabelled, and a second version of the dataset stops matching the one in the manuscript.

The Medical edition draws Kaplan–Meier curves, tests the difference between groups with the log-rank test, and fits Cox proportional hazards models reporting the hazard ratio. Survival analysis is in the Medical and Ultimate editions only. Comparing survival between groups covers what the log-rank test does and does not tell you.

Survival analysis in detail →
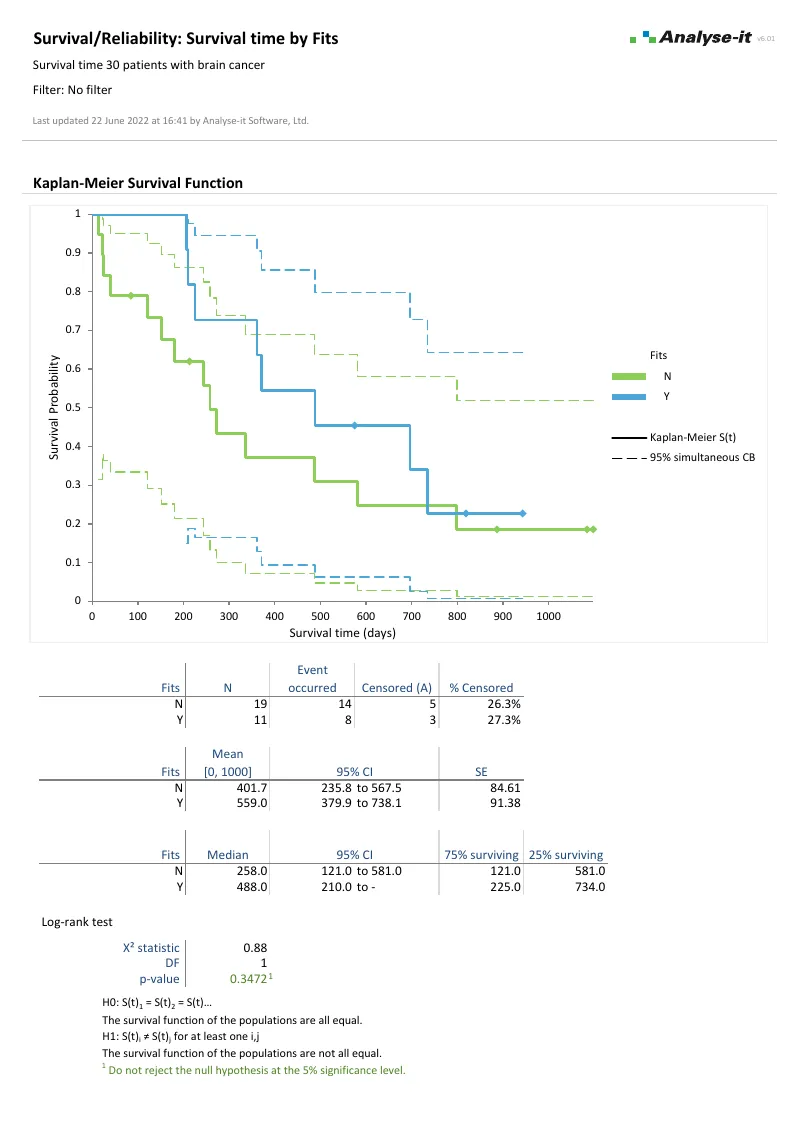
The Kaplan-Meier survival example report: page one of the PDF as Analyse-it produces it. 3 pages Kaplan-Meier survival
Brain cancer survival, 30 patients.
Two analyses of one dataset — survival by treatment, 19 patients against 11, and survival by tumour grade over three groups. Survival curves with confidence bands, mean and median survival with CIs, quartile survival times, and a log-rank test for each.
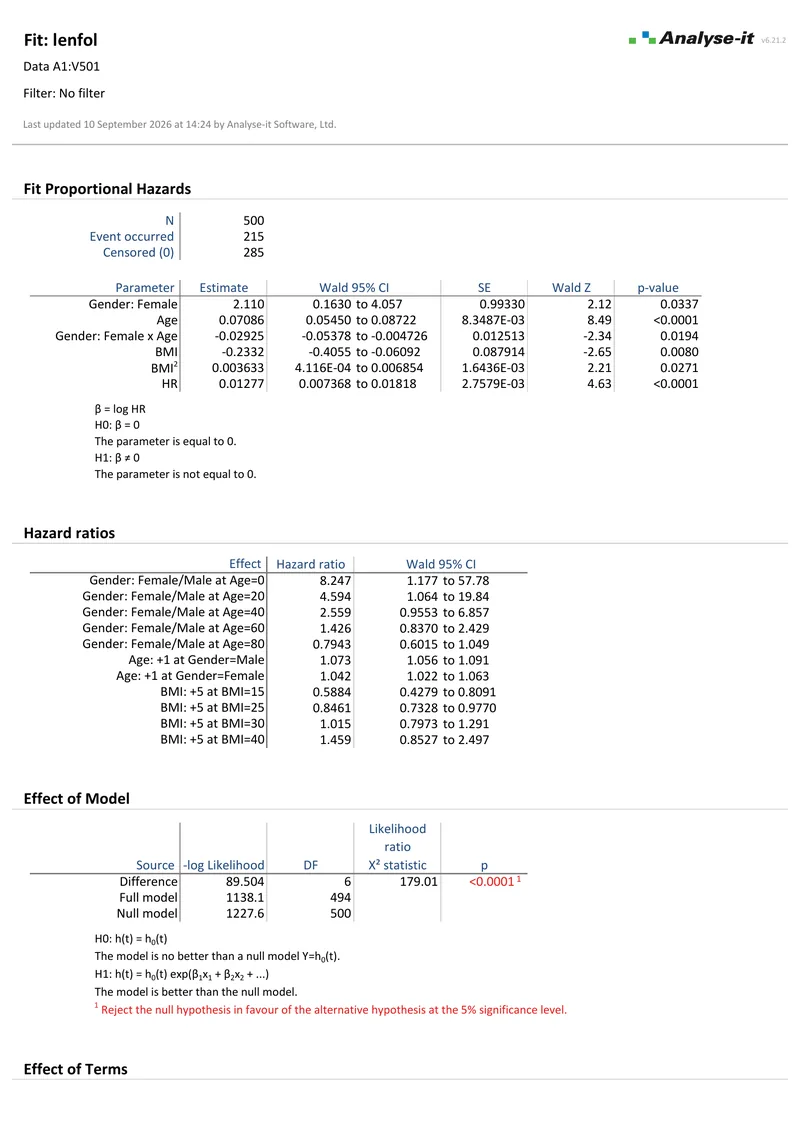
The Cox proportional hazards example report: page one of the PDF as Analyse-it produces it. 2 pages Cox proportional hazards
Worcester Heart Attack Study, 500 patients.
215 events and 285 censored. Sex, age, their interaction, body mass index as a quadratic, and heart rate. Parameter estimates with Wald 95% CIs, hazard ratios evaluated at several ages and BMI values, and likelihood ratio tests for the model and each term.

Diagnostic accuracy and the ROC comparison reviewers ask for

Reporting an AUC is straightforward. Showing that your marker beats the established one is the claim that gets challenged. Defending it needs a test that accounts for both markers being measured in the same patients. Comparing two diagnostic tests covers what the DeLong test does and when the paired form is required.

Analyse-it fits empirical ROC curves under EP24-A2 and reports the AUC with DeLong confidence intervals and a Z test. Up to ten paired or independent tests can be compared at once, under equality, equivalence or non-inferiority hypotheses. Sensitivity, specificity, predictive values, likelihood ratios, the diagnostic odds ratio and Youden’s index all come with confidence intervals. For a test with a categorical result, qualitative evaluation under EP12-A2 uses Clopper–Pearson, Wilson and Newcombe intervals rather than the normal approximation. The difference matters when the sample is small or the proportion is near one.

Diagnostic accuracy in detail →
The EP24-A2  Appendix D example report: page one of the PDF as Analyse-it produces it. 2 pages EP24-A2 — Appendix D
OxLDL and LDL diagnostic accuracy.
50 subjects, 28 of them with the condition. ROC curves for both markers with AUC, CIs and a test against 0.5 — OxLDL 0.80, LDL 0.56 — and a DeLong comparison of the two curves. A second report adds the bi-histogram and decision threshold plot for OxLDL alone.
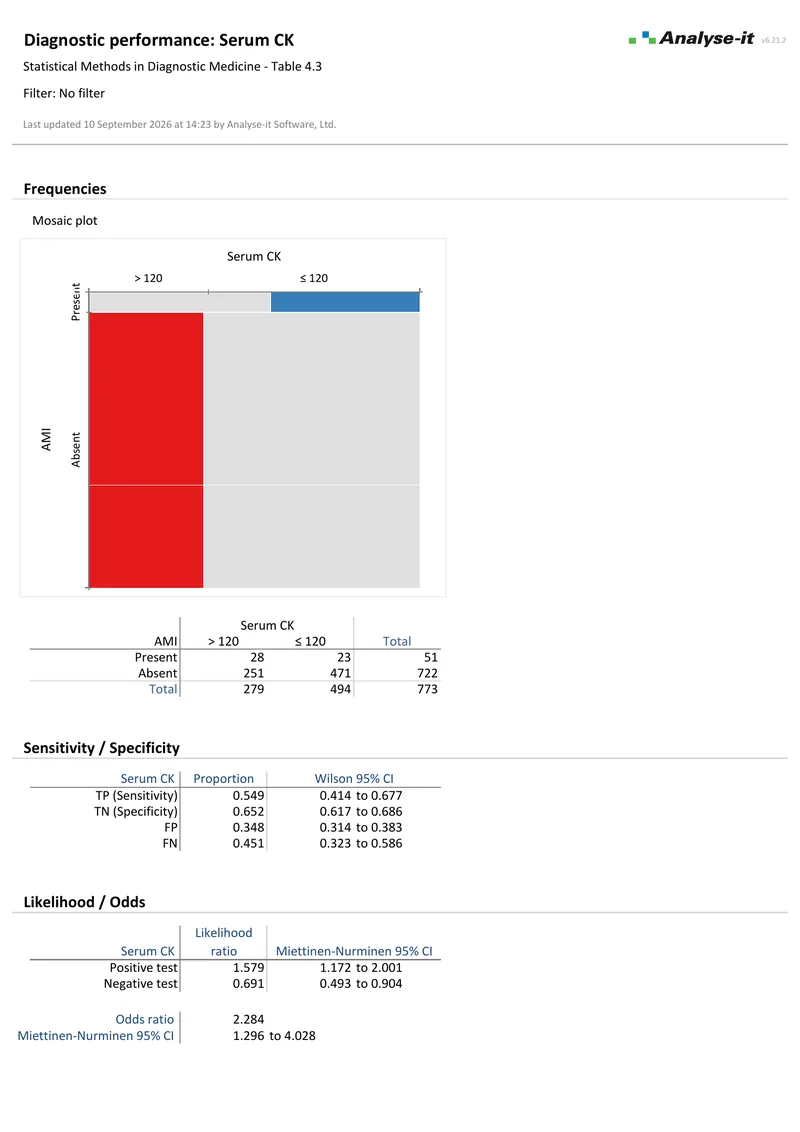
The serum creatine kinase diagnostic performance example report: page one of the PDF as Analyse-it produces it. 2 pages Serum creatine kinase for acute myocardial infarction
Statistical Methods in Diagnostic Medicine, table 4.3.
773 subjects at a fixed 120 U/L cut-off. The 2×2 table with a conditional odds ratio, exact CI and Fisher test, then sensitivity and specificity with Wilson CIs, likelihood ratios with Miettinen-Nurminen CIs, and a mosaic plot.

Bland–Altman agreement, judged against a limit you set first

Correlation is still the most common wrong answer to an agreement question. Two methods can correlate almost perfectly and disagree by a clinically important amount at every concentration, because correlation measures association and not closeness. Why correlation is the wrong measure sets out the argument in full.

Analyse-it produces the difference plot with mean and median bias and their confidence intervals. Limits of agreement are drawn for constant or non-constant precision, with a linear fit where the bias depends on concentration. The allowable difference band is one you specify before looking at the data. Cohen’s kappa and weighted kappa cover observer agreement on categorical outcomes.

Agreement and difference plots →
The EP21-A LDL cholesterol total analytical error example report: page one of the PDF as Analyse-it produces it. 2 pages EP21-A — Table 2
LDL cholesterol total analytical error.
100 observations. Difference plot and mountain plot with an allowable difference of ±10 mg/dL, median difference with a 90% CI, and 95% limits of agreement.
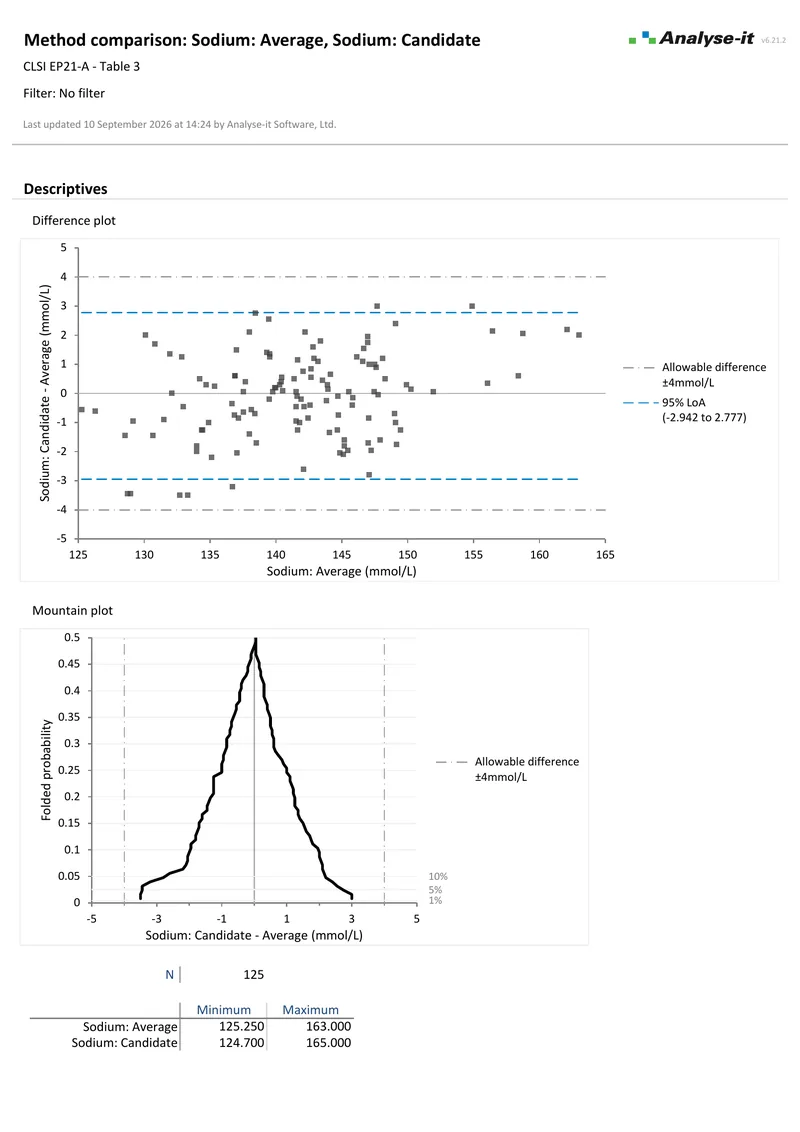
The EP21-A sodium total analytical error example report: page one of the PDF as Analyse-it produces it. 2 pages EP21-A — Table 3
Sodium total analytical error.
125 observations. Difference plot and mountain plot with an allowable difference of ±4 mmol/L, mean difference with a 90% CI, and 95% limits of agreement each with their own CI.

Reference intervals from the sample you actually have

The method has to match the sample size. Around 120 observations per partition supports the non-parametric approach. Below that, a robust or parametric method on transformed data is usually the defensible choice, and the reason for choosing it belongs in the paper.

Analyse-it estimates intervals by parametric, non-parametric, robust bi-weight, bootstrap and Harrell–Davis methods, with confidence intervals on the limits themselves. Partition by sex, age or another factor, screen outliers with Tukey box plots, and apply log, Box–Cox or one of the other transformations where the distribution requires it. Partitioning a reference interval covers when a separate interval is justified and when it is over-fitting.

Reference intervals →
The EP28-A3C  Table 4 example report: page one of the PDF as Analyse-it produces it. 2 pages EP28-A3C — Table 4
Calcium reference intervals by sex.
120 observations per sex, reported separately. Distribution with descriptive statistics, and nonparametric reference limits from the (N+1)p quantile with 90% CIs.
The EP28-A3C robust reference interval example report: page one of the PDF as Analyse-it produces it. 1 page EP28-A3C — Appendix B
Calcium reference interval, robust method.
20 observations. Reference limits from the robust biweight prediction interval, with bootstrap 90% CIs from 500 samples.

Regression and the statistics behind the rest of the paper

Every edition includes the full Standard edition, so the rest of the manuscript does not require a second package. In the same ribbon you have hypothesis tests, ANOVA with multiple comparison procedures, linear and logistic regression with odds ratios, contingency tables and principal component analysis.

The Standard edition statistics →
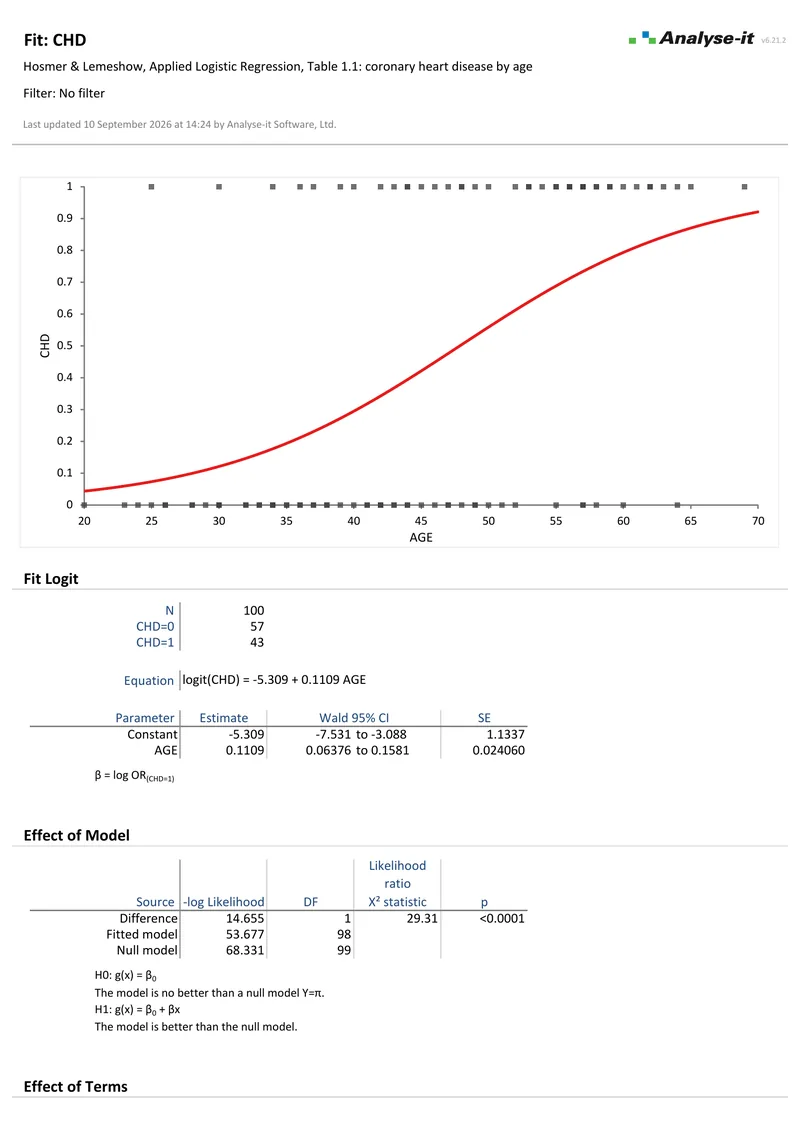
The simple logistic regression example report: page one of the PDF as Analyse-it produces it. 2 pages Simple logistic regression
Coronary heart disease by age.
Hosmer and Lemeshow, table 1.1. 100 observations and a single continuous predictor. Fitted logit with parameter estimates and Wald 95% CIs, the odds ratio per year of age, and a likelihood ratio test for the model.
The independent-samples t-test example report: page one of the PDF as Analyse-it produces it. 2 pages Independent-samples t-test
Calcium supplementation and blood pressure, 21 observations.
Five-number summary by group with side-by-side plots, Fisher F test for the variance ratio, and Student’s t test of the difference in means against a hypothesised difference of 3.

More example analyses

A paper is rarely one analysis. These are the tests and models that surround the headline result — paired comparisons, adjusted models, multivariable modelling and variable reduction — all four from the Standard edition that every edition includes.
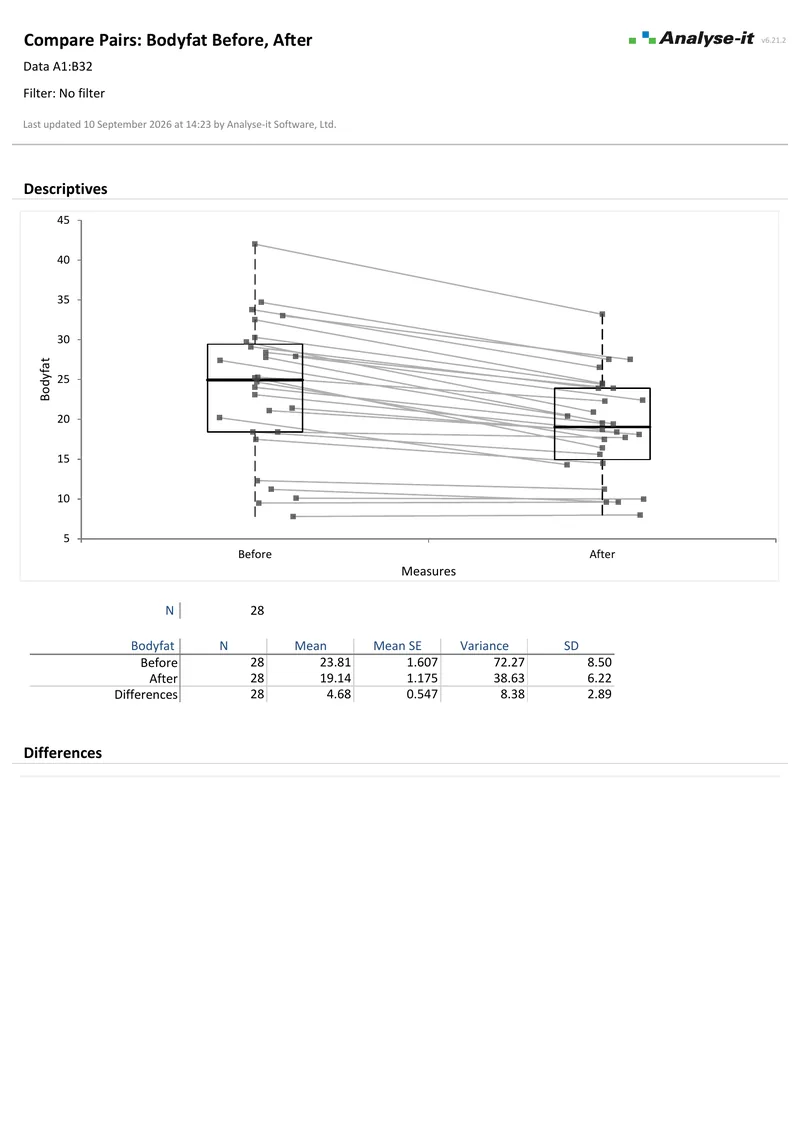
The compare pairs example report: page one of the PDF as Analyse-it produces it. 2 pages Compare pairs
Body fat before and after an exercise programme.
28 paired observations. Descriptive statistics for both conditions and for the differences, Hodges-Lehmann shift estimate with a 95.49% CI, and the Wilcoxon signed-ranks test.
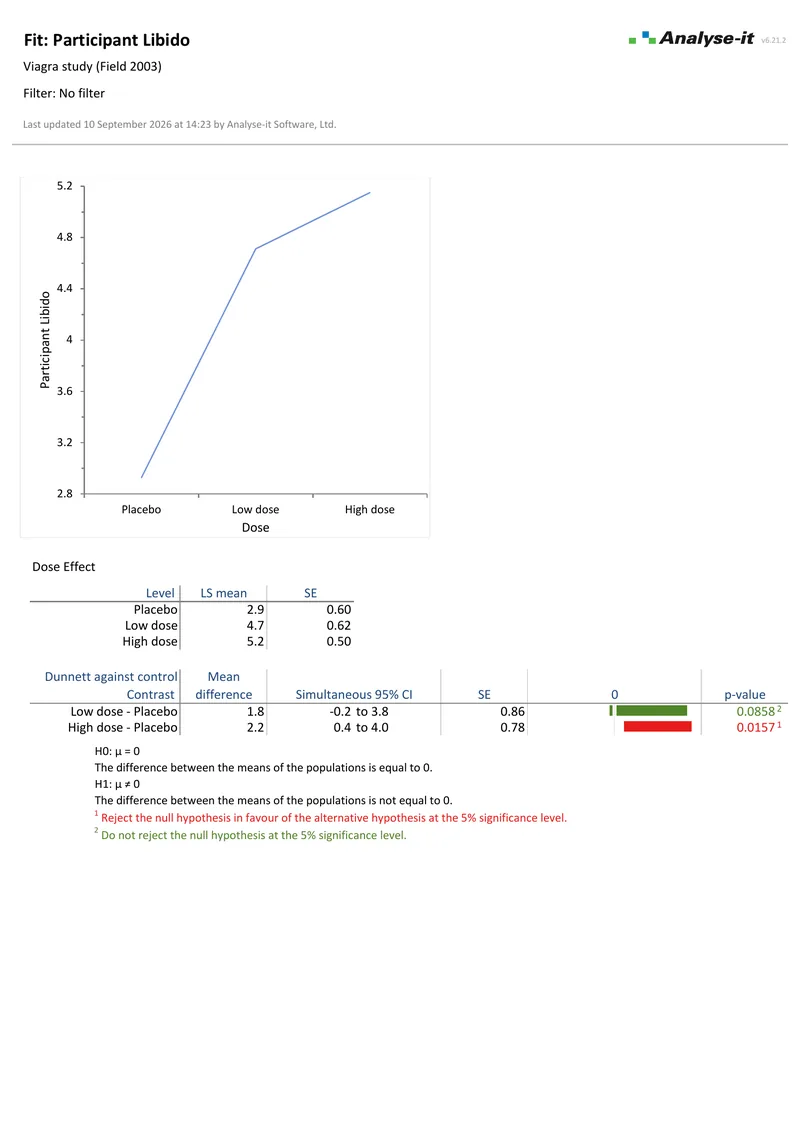
The ANCOVA example report: page one of the PDF as Analyse-it produces it. 2 pages ANCOVA
Three dose levels with a covariate, 30 participants.
Field 2003. A three-level factor — placebo, low dose, high dose — with a participant-level covariate, 30 observations. F tests for dose and covariate, LS means, main effect plot, and Dunnett comparisons against the placebo control.
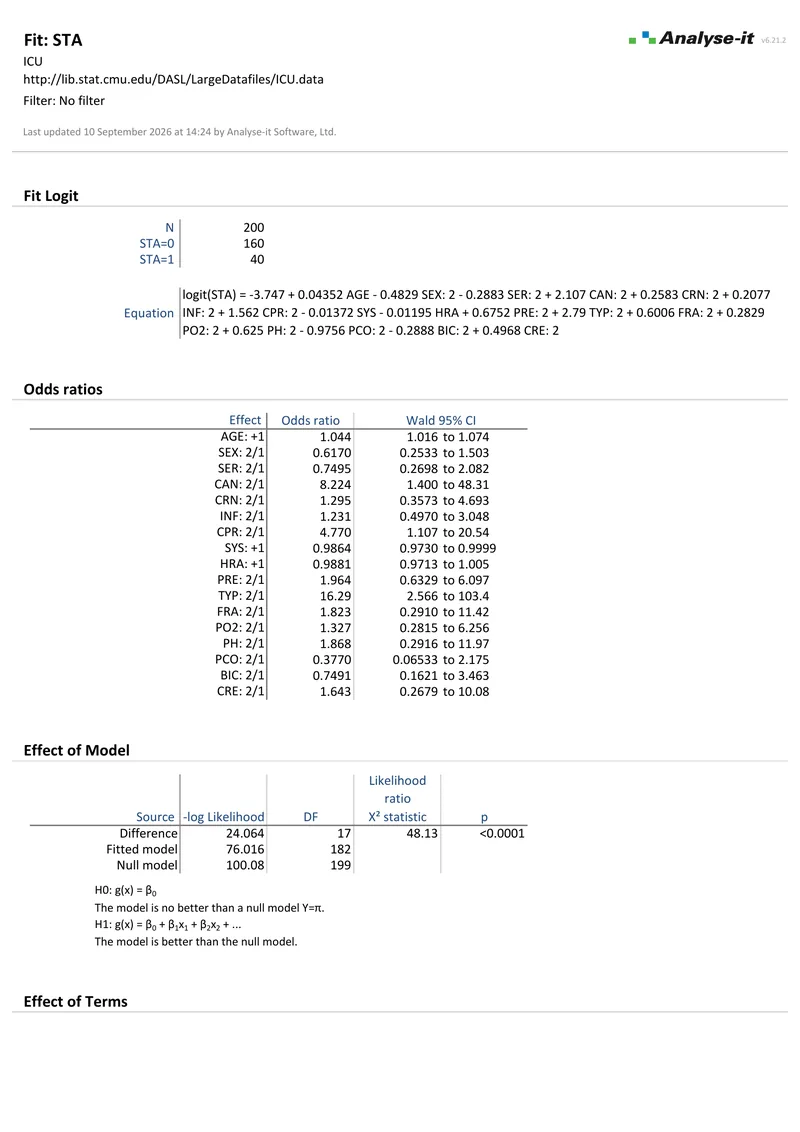
The binary logistic regression example report: page one of the PDF as Analyse-it produces it. 2 pages Binary logistic regression
Intensive care unit survival, 17 predictors.
200 observations. Odds ratios with Wald 95% CIs and likelihood ratio tests for the model and for each term. Age, cancer, CPR, systolic blood pressure and admission type are significant at 5%.
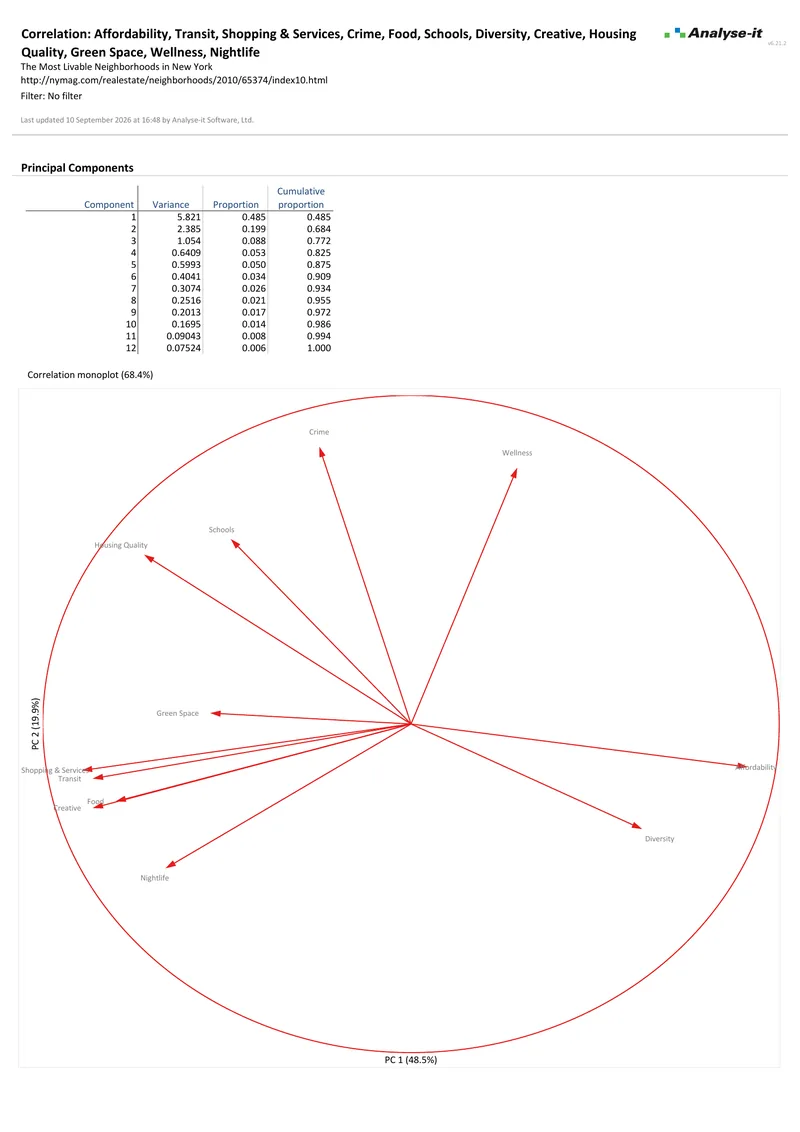
The principal component and factor analysis example report: page one of the PDF as Analyse-it produces it. 3 pages PCA and factor analysis
New York neighbourhood liveability, 12 variables.
50 neighbourhoods. Principal components with eigenvalues and coefficients and a biplot labelled by borough, a correlation monoplot, and a common factor analysis reporting uniqueness, communality and factor loadings. Two components carry 68.4% of the variance.

Which edition a research group needs

Survival analysis, diagnostic accuracy, agreement and reference intervals are the Medical edition, and it includes the full Standard edition — the tests, ANOVA and regression behind the rest of the paper — as every edition does. Where the work is establishing how a measurement method performs rather than answering a clinical question, the Method Validation edition is the one to read: it holds precision, linearity, detection limits and the CLSI evaluation protocols, and it shares agreement, diagnostic accuracy and reference intervals with Medical. Ultimate holds everything, and the comparison table lists every analysis against every edition.

Every calculation is performed by Analyse-it — no Excel formulas and no third-party functions — validated against the NIST Statistical Reference Datasets and thousands of internal test cases. Results are ordinary Excel workbooks a co-author, reviewer or sponsor can open without a licence, and they carry no formulas, so what you reported is what you find when the paper comes back. See how we develop and validate Analyse-it →

Free trial and pricing

Try it on your own data first. The 15-day trial is every feature from all five editions, with no sign-up and no licence key — install it and start straight away.

Medical edition from US$ 340 per year, or US$ 815 for a perpetual licence. Every purchase carries a 30-day money-back guarantee. Need a quote for purchasing? Add the licence to the cart and save it as a PDF quote.