
You have two candidate markers for the same condition, measured on the same set of patients. One has a higher area under the ROC curve than the other. Is it genuinely the better test, or is the gap just sampling noise? Answering that correctly depends on one easily missed fact: because both markers were measured on the same people, their AUCs are correlated. The standard tools for comparing two numbers assume they are not.
When the same patients contribute to both ROC curves, the two AUC estimates move together. A run of unusually easy-to-classify patients inflates both markers’ AUCs at once. A run of ambiguous ones deflates both. That shared dependence on the same subjects is a positive correlation between the two estimates. The correlation has a useful consequence. The difference between two correlated AUCs is estimated more precisely than it would be from two independent samples, because the shared patient-level noise partly cancels when you subtract.
An ordinary two-sample comparison throws that away. Assuming the two AUCs are independent overstates the variance of their difference. The comparison becomes needlessly conservative and can miss real differences the paired design could have detected. The fix is to use the correlation rather than ignore it.
DeLong’s test is a non-parametric test for whether two areas under the ROC curve differ, when both curves come from the same subjects. The test estimates how strongly the two AUCs are correlated, and uses that correlation to work out the standard error of the difference between them. The test then reports a p-value and a confidence interval for that difference.
DeLong’s method estimates the full covariance structure of the two AUCs directly from the data, using the theory of U-statistics. The AUC is, in effect, a Mann–Whitney statistic. From the covariance it computes the variance of the difference between the two AUCs, correctly incorporating their correlation. The test statistic is the difference divided by its standard error, referred to a normal distribution.
The method is entirely non-parametric, using only the ranks of the marker values and assuming nothing about their distribution. That generality is one reason DeLong’s test has become the default for comparing correlated ROC curves.
The same covariance machinery gives a DeLong confidence interval for the difference in AUCs, and that interval is more informative than the p-value alone. Suppose the AUC of test B comes out 0.04 higher than that of test A. If the confidence interval on that difference runs from 0.01 to 0.07, the whole interval lies above zero. The data then support a real advantage for test B, of somewhere between 0.01 and 0.07. If instead the interval runs from −0.02 to 0.10, the same 0.04 tells you very little. That interval includes zero, so the data are consistent with test B being slightly worse as well as considerably better. The point estimate is identical in both cases. Only the interval separates a result you can act on from one you cannot.
The same variance estimate also produces a confidence interval around a single AUC, which is where many readers first meet the name. A lone AUC quoted with a DeLong interval has had its standard error computed this way.
The method comes from a single 1988 paper, and readers often arrive looking for it by name:
DeLong ER, DeLong DM, Clarke-Pearson DL. Comparing the areas under two or more correlated receiver operating characteristic curves: a nonparametric approach. Biometrics. 1988;44(3):837–845.
The paper’s contribution is the use of U-statistics theory to get the covariance between AUCs without any distributional assumption. The method handles more than two curves at once, not just a pair. The test is usually written DeLong’s test, sometimes the DeLong test; both names refer to this paper.
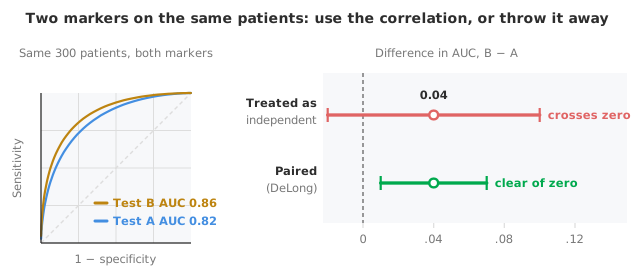
The paired design, with both tests run on every subject, is the one DeLong’s correlated-AUC test is built for. Pairing is almost always the stronger design, needing fewer subjects for the same power because each patient serves as their own control.
Occasionally the two tests are measured on different groups of subjects (an unpaired design). Then the AUCs are independent and a simpler comparison applies. The variance of the difference is just the sum of the two AUCs’ separate variances, with no covariance term. Match the analysis to the design. Using the paired test on unpaired data, or the reverse, gets the standard error wrong.
With three or more markers, every pairwise comparison you run adds to the chance of a spurious significant difference somewhere in the set. If you are going to test all pairs, adjust for the multiplicity rather than reading each comparison at a naive 5%. Comparing only the best-looking pair, chosen after seeing the results, is a multiple comparison in disguise and inflates the apparent difference.
The sample size you need to detect a difference between two AUCs depends on three things. The first two are how large a difference matters clinically and where on the scale the AUCs sit. The third is how strongly the two markers are correlated.
The variance of an AUC estimate shrinks as it approaches 1. A difference between 0.90 and 0.95 is therefore easier to establish, and needs fewer subjects, than the same gap lower down. A high correlation between the two markers helps too, because it tightens the estimate of the difference and cuts the required sample size. A paired design on strongly related markers is both the most powerful and the most economical. Size the study on the difference you care about, not on the AUCs in isolation.
Download the CLSI EP24-A2 diagnostic performance example workbook (.xlsx) — oxidised LDL (OxLDL) and LDL measured on the same 50 subjects, each AUC with its confidence interval and the paired DeLong comparison of the two curves. The workbook is ready to open in the Analyse-it trial.
The example workbook is downloading.
It opens in Excel on its own — the data and the finished results are both in it. Analyse-it is what lets you change the analysis and re-run it, try the same study on your own data, or work through it to see how the software handles it.
Every feature from all five editions for 15 days.
Comparing correlated AUCs as if independent. Two tests on the same subjects need the paired DeLong comparison. An independent two-sample test overstates the variance and can miss real differences.
Reading only the p-value. Report the difference in AUCs with its confidence interval. A non-significant result with a wide interval means “underpowered”, not “equivalent”.
Comparing global AUCs when only part of the curve matters. If the two tests are only ever used in a high-specificity region, a difference in overall AUC can be irrelevant. Compare where you operate.
Testing only the best-looking pair. Picking the pair with the largest apparent gap after seeing all the curves, then testing only that pair, is an unadjusted multiple comparison. Pre-specify the comparisons, or correct for the number of tests.
Analyse-it runs the paired comparison on your own data, inside Excel:
Every feature from all five editions for 15 days. Diagnostic performance is in the Medical, Method Validation and Ultimate editions, from US$ 340 a year. Validated against NIST and CLSI reference datasets. Start from the ROC and AUC guide if a single curve is where you are.