Every feature from all five editions for 15 days.
Method Validation edition from US$ 475 a year · 30-day money-back guarantee.
Analytical performance studies span the entire IVD product lifecycle. You characterise precision and linearity during feasibility, compare against the predicate for a 510(k), and establish reference intervals and diagnostic accuracy for product labelling. Then you support customer laboratories verifying your claims after installation. Each stage has its own experimental design and its own reporting requirements, and most have a CLSI protocol you can follow if you want one. The underlying statistics are the same throughout, and they are what you actually work with.
Analyse-it covers the statistics eleven of those protocols call for — EP05-A3, EP06-Ed2, EP09-A3, EP10-A3-AMD, EP12-A2, EP14-A3, EP15-A3, EP17-A2, EP21-A, EP24-A2 and EP28-A3c. The software does not confine you to them, and nothing here is a protocol wizard. The analyses are the statistics and plots themselves. You can follow a guideline exactly, depart from it where your device needs something else or run a study no guideline describes. Your R&D team, your regulatory group and your field support engineers all work in the same tool, producing the same output, from the same Excel workbooks. When a field engineer needs to replicate a study your R&D team ran two years ago, they open the original workbook and run the same analysis.
The studies below are the ones that most often appear in a submission, in roughly the order you run them. Each links to a guide covering how the study is designed and what the common mistakes are — useful whichever software you end up using.
| Stage | Study | Protocol | Guide |
|---|---|---|---|
| Feasibility & design verification | Precision — repeatability to reproducibility | EP05-A3 | Establishing precision |
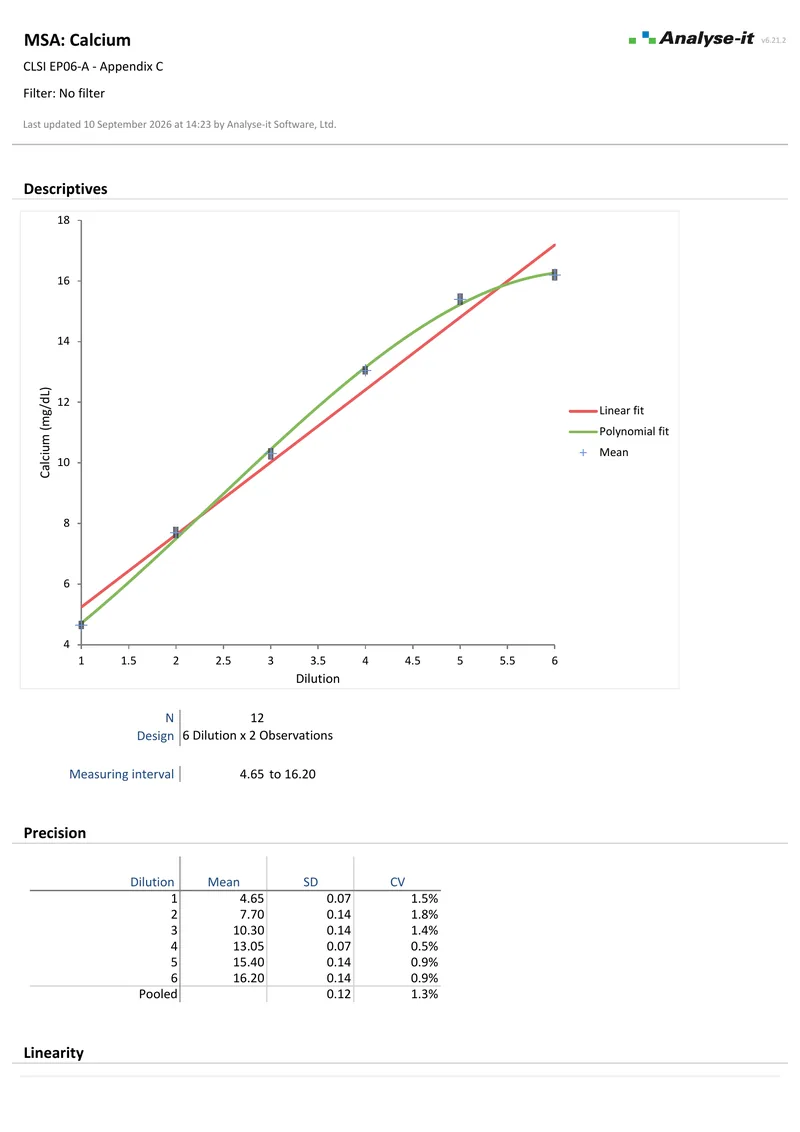
| Linearity & measuring interval | EP06-Ed2 | Assessing linearity | |
| Detection capability — LoB, LoD, LoQ | EP17-A2 | LoB, LoD and LoQ explained | |
| Preliminary evaluation — bias, nonlinearity, drift, carry-over | EP10-A3-AMD | Rapid method evaluation | |
| Submission | Method comparison against the predicate | EP09-A3 | Performance studies for a 510(k) |
| Qualitative agreement — PPA and NPA | EP12-A2 | PPA and NPA vs sensitivity and specificity | |
| Commutability of calibrators and controls | EP14-A3 | Commutability explained | |
| Labelling | Reference intervals | EP28-A3c | Choosing a reference interval method |
| Diagnostic accuracy and cut-off | EP24-A2 | ROC curves and AUC | |
| Field support | Customer verification of your precision claim | EP15-A3 | Verifying a manufacturer’s claim |
| Reference interval transfer to the customer’s population | EP28-A3c | Transferring a reference interval |
Not sure which apply to your device? The CLSI EP protocol roadmap works through it from the question rather than the protocol number.
The protocol column is where a submission usually anchors, but it is not how the software is organised. Passing-Bablok and Deming regression, non-parametric reference intervals and most of the rest have been in Analyse-it since 1997. In most cases that was before the guidelines that now reference them. You are choosing an analysis and configuring it, not starting a protocol you then have to finish.


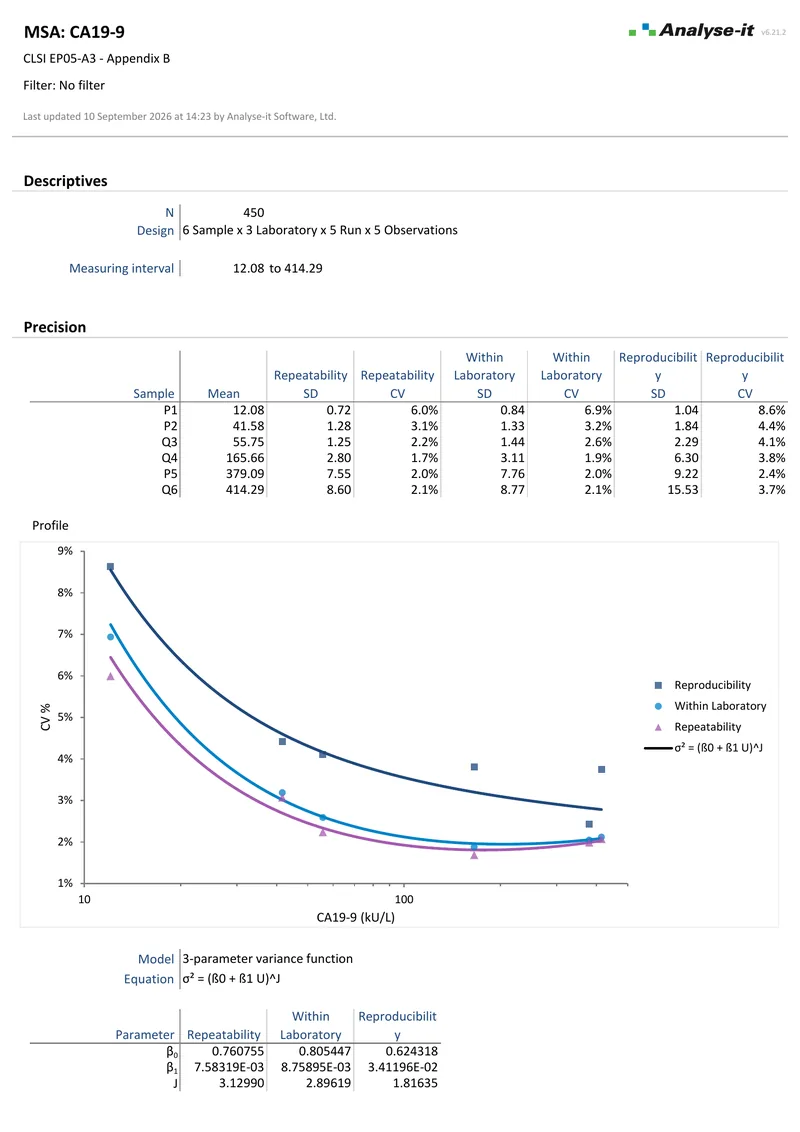
During feasibility and design verification you are running precision studies across multiple sites, instruments and reagent lots, to understand how performance varies with configuration. The designs are complex — three or four nesting levels, often unbalanced when one site cannot run as many replicates as another. You need the full variance component breakdown rather than a single repeatability number. You also need it at every concentration level, because immunoassay precision is rarely constant across the measuring range.
Analyse-it handles these designs directly, unbalanced nesting included. The precision profile it produces feeds straight into the detection capability estimate. LoQ therefore comes from the same variance function you have already fitted rather than from a second, separate study.
Precision, linearity and detection capability in detail →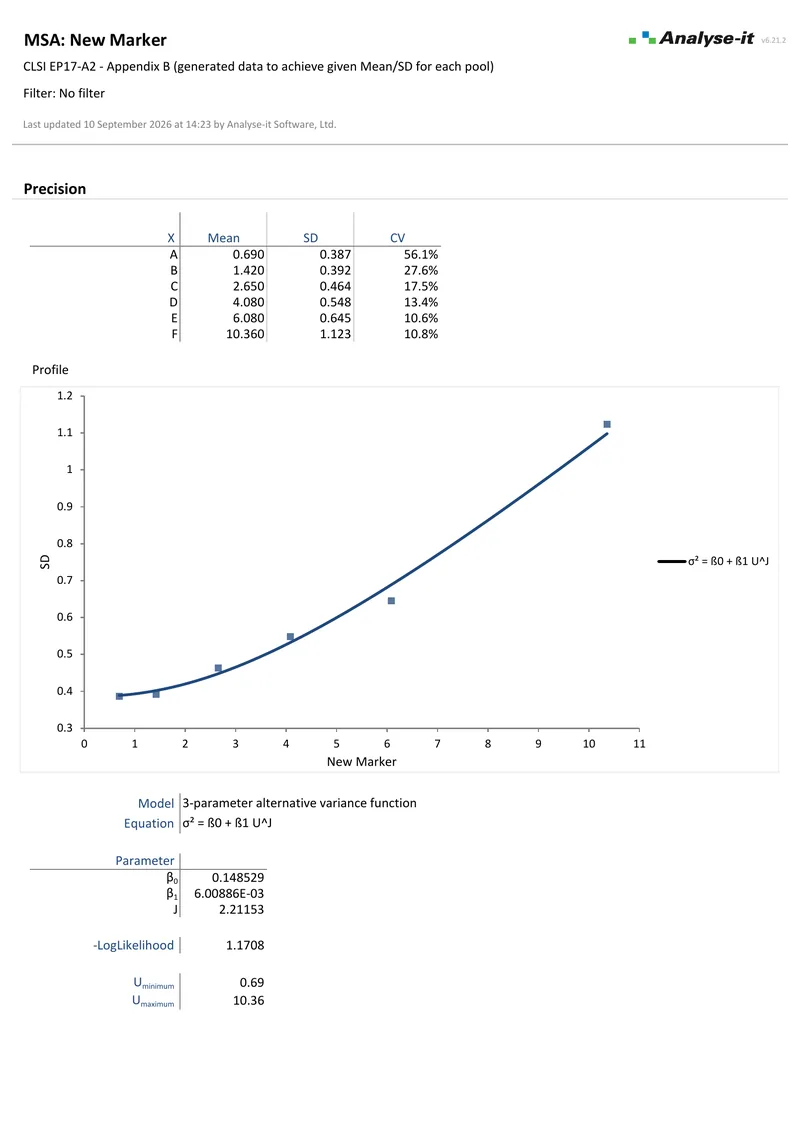 4 pages
EP17-A2 — Appendix B
4 pages
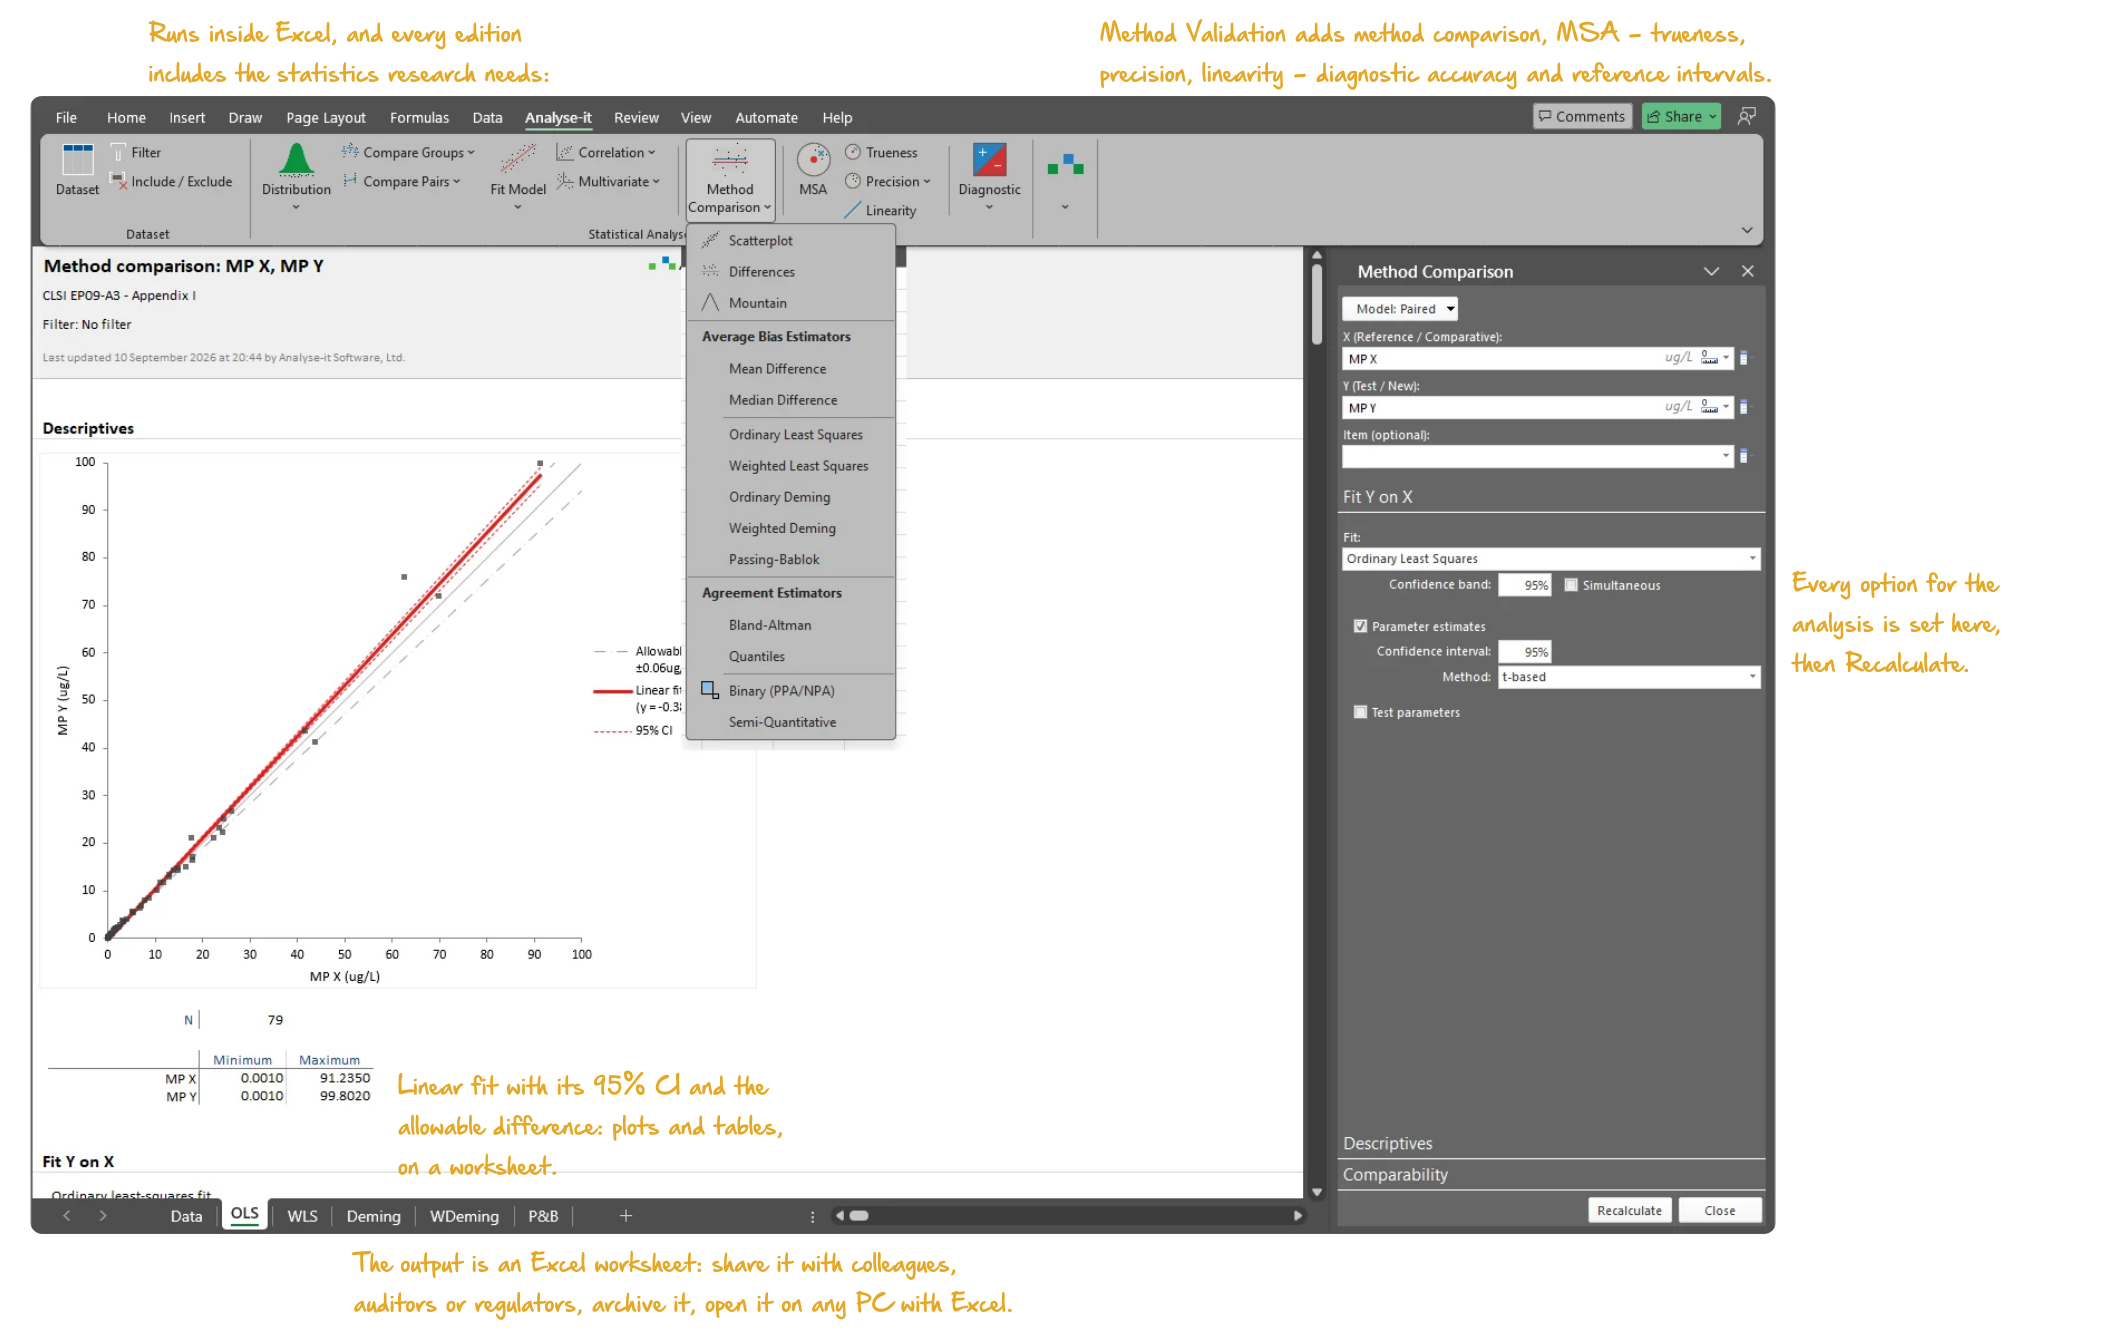
EP17-A2 — Appendix BThe method comparison study is the centrepiece of most 510(k) submissions. You are collecting 40–100 patient samples spanning the clinical measuring range and running them on both your method and the predicate. The aim is to demonstrate that the bias is clinically acceptable at the decision points that matter. The choice of regression method affects the bias estimate — and reviewers will ask why you chose the one you did.
Analyse-it fits all five regressions and Bland-Altman to the same dataset in one analysis, so the choice is something you can show a reviewer rather than assert. Showing it matters when the bias estimate at a decision point moves depending on the fit. Choosing a regression for method comparison sets out when each is the defensible one.
Method comparison in detail →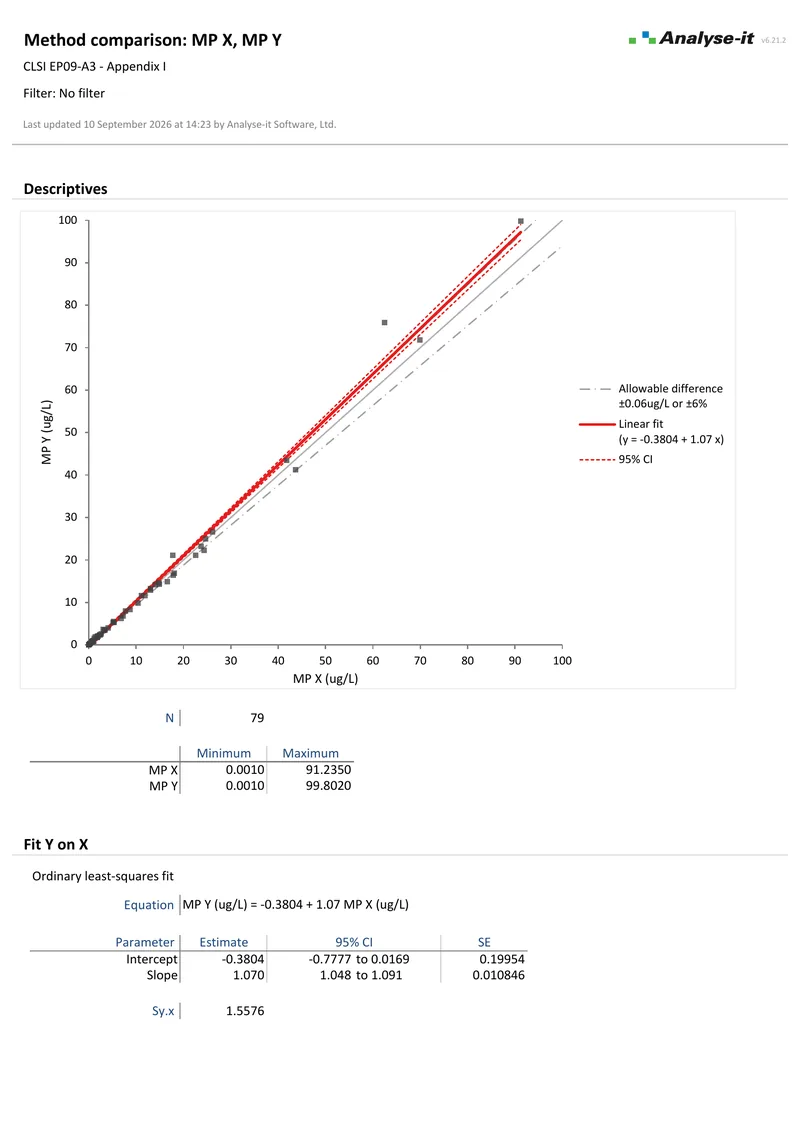 10 pages
EP09-A3 — Appendix I
10 pages
EP09-A3 — Appendix I 2 pages
EP09-A3 — Appendix I
2 pages
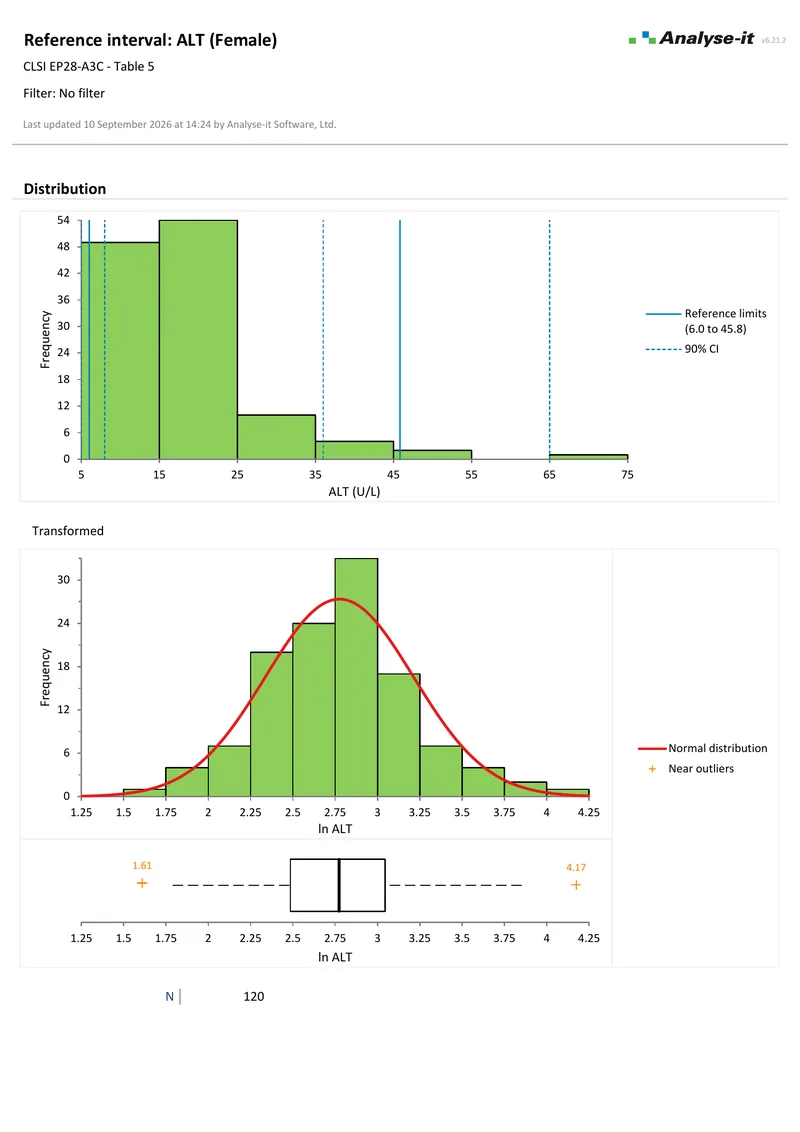
EP09-A3 — Appendix IReference intervals and diagnostic accuracy claims go into the package insert and the regulatory submission. For reference intervals that means recruiting a sufficiently large reference population and partitioning by sex, age or another biologically relevant factor. The quantile method then follows from the sample size and distribution. For diagnostic accuracy it means comparing your test against a reference standard, often across several biomarker configurations or assay versions. You then determine the threshold that balances clinical sensitivity against specificity.
Analyse-it covers the whole EP28-A3c workflow, and lets each partition use the quantile method its own sample size justifies rather than forcing one choice across every subgroup. For the accuracy claim, up to ten assay configurations or biomarker panels can be compared in a single ROC analysis per EP24-A2. The decision threshold plot from the same analysis is how the labelled cut-off is chosen.
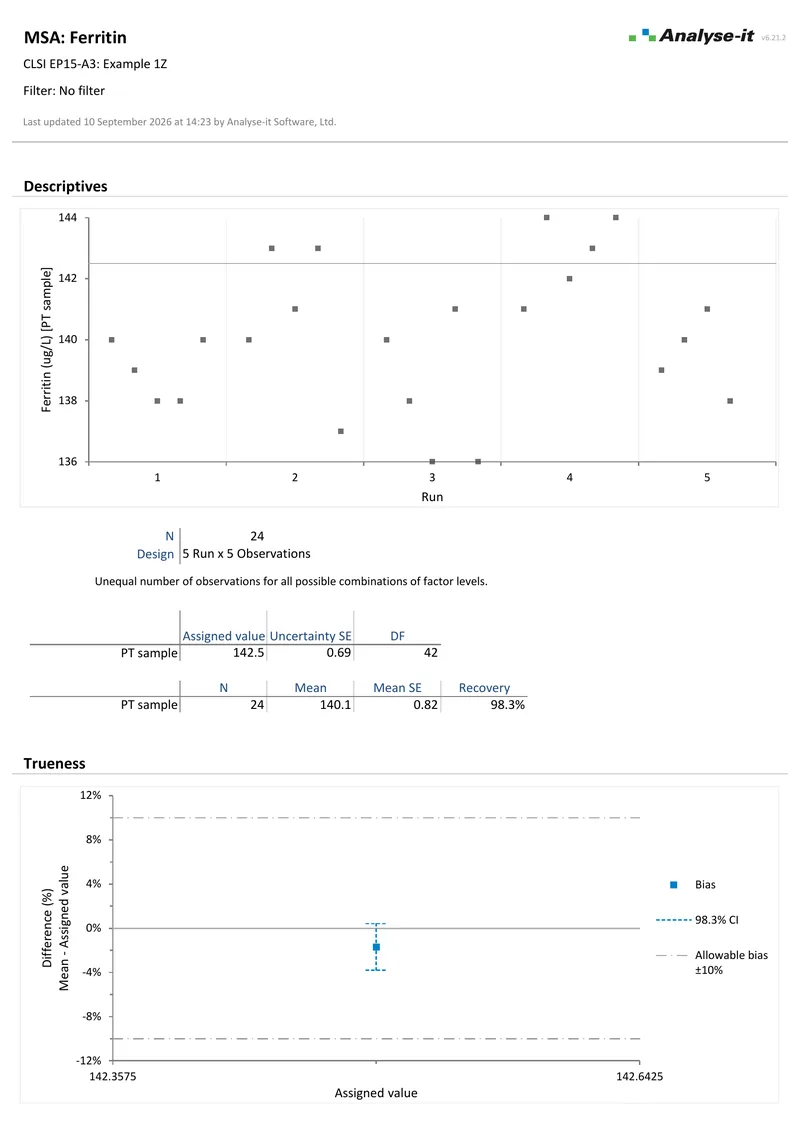
Reference intervals → Diagnostic performance →Once your product is on the market, customer laboratories need to verify your claimed performance before reporting patient results. When something does not match, your field application specialist needs to investigate. The investigation might take one of three forms. One is a quick EP15-A3 precision and trueness verification against your published claims. Another is comparing the laboratory’s results against a reference using the same regression methods your R&D team used. The third is verifying that the reference intervals transfer correctly to the laboratory’s population.
Analyse-it runs the same CLSI protocols your R&D team used to establish the claims. Precision and trueness are verified with χ² and equivalence tests per EP15-A3. Reference intervals are transferred and verified with binomial tests. A method comparison runs against the laboratory’s existing procedure. Your field team does not need a biostatistician. What they need is the same tool, producing the same output, in workbooks the laboratory can open on any machine with Excel without an Analyse-it licence.
Precision and trueness verification →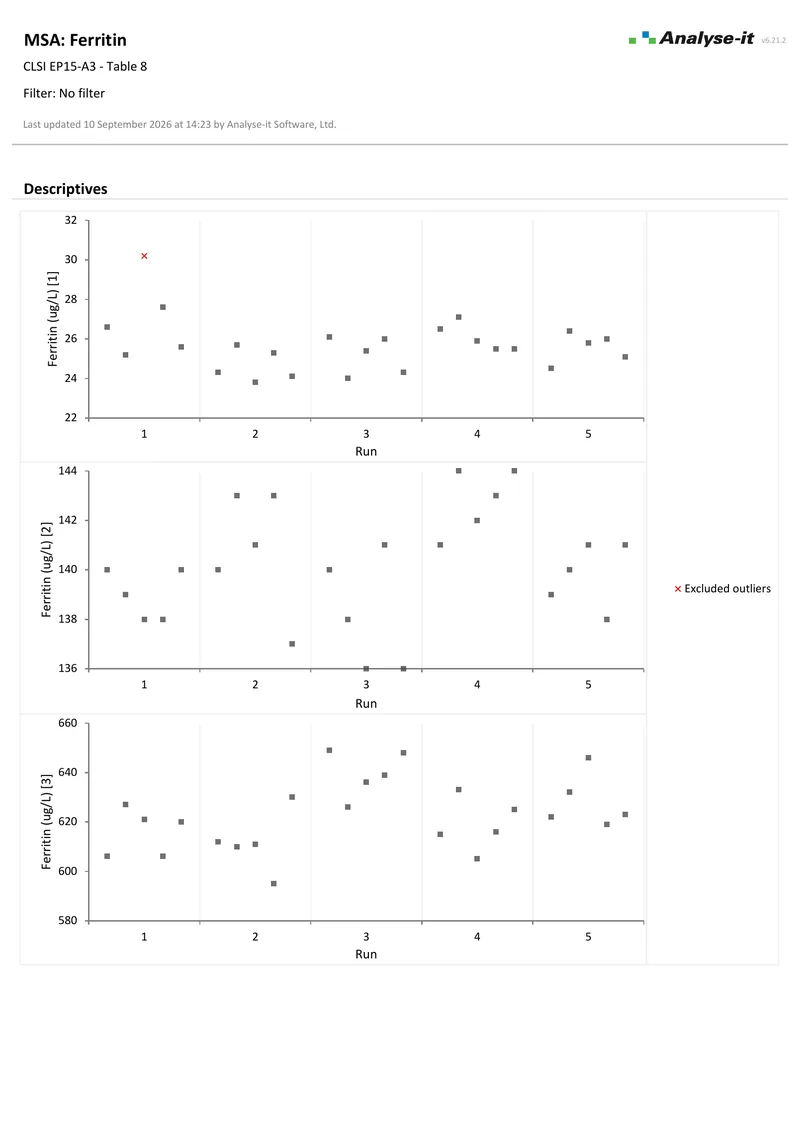 3 pages
EP15-A3 — Table 8
3 pages
EP15-A3 — Table 8Download the CLSI example datasets, open them in the trial and see exactly what the output looks like.
 6 pages
EP06-A — Appendix C
6 pages
EP06-A — Appendix C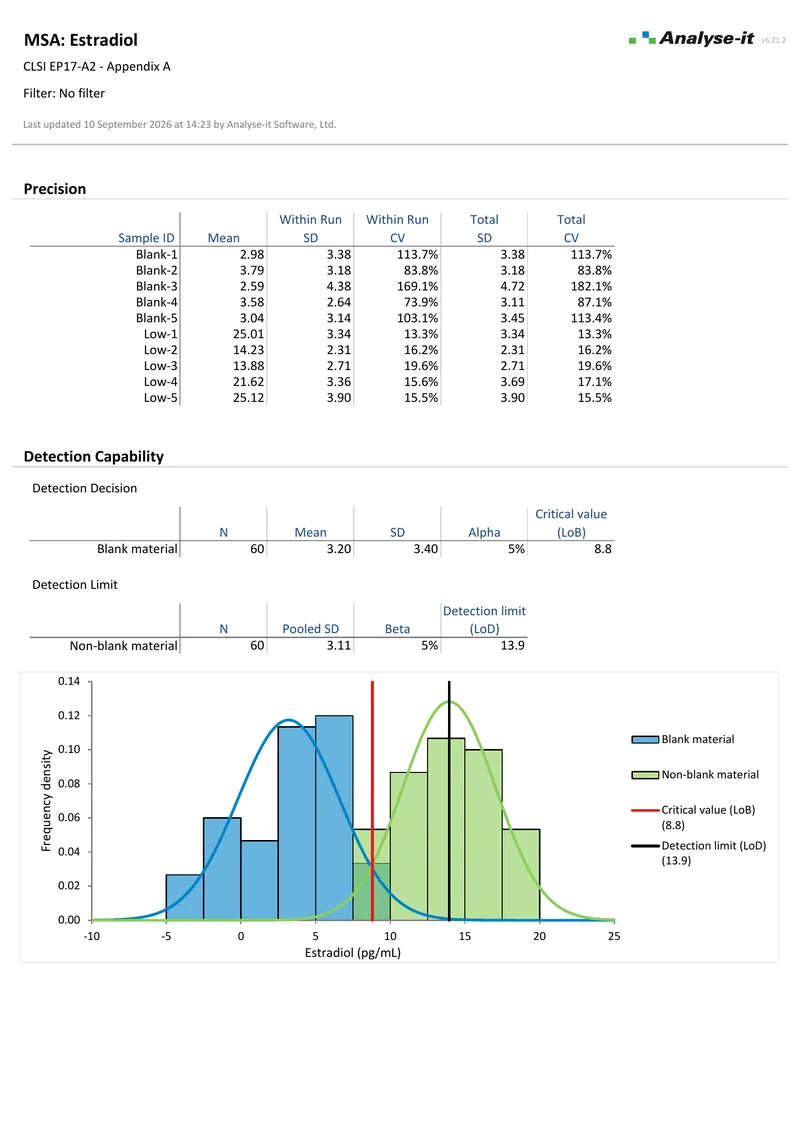 2 pages
EP17-A2 — Appendix A
2 pages
EP17-A2 — Appendix A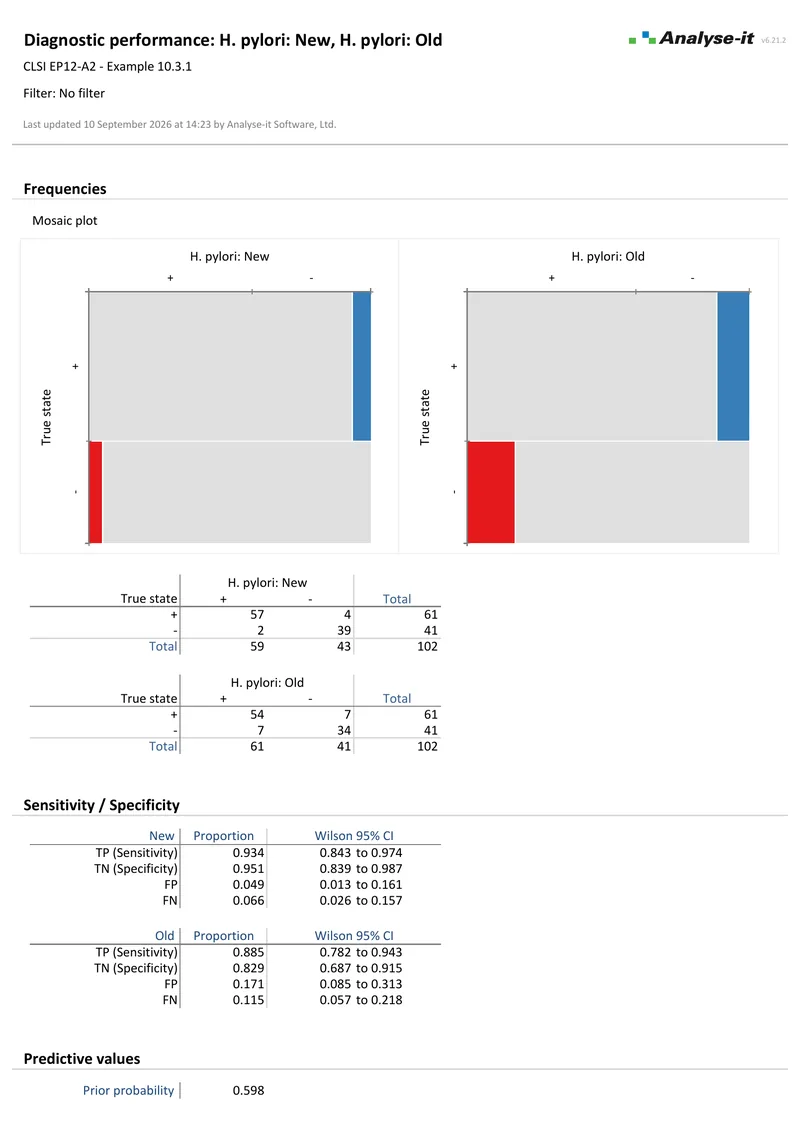 2 pages
EP12-A2 — Example 10.3.1
2 pages
EP12-A2 — Example 10.3.1 2 pages
EP24-A2 — Appendix D
2 pages
EP24-A2 — Appendix DThe studies above are the Method Validation edition, licensed per user with volume pricing for teams and no per-analysis charges. For manufacturers with in-house QC requirements, the Quality Control & Improvement edition adds Levey-Jennings charts, detection rules — WECO, Nelson, Montgomery — CUSUM, EWMA, process capability and Pareto analysis. Ultimate combines method validation and quality control in a single licence.
Every calculation is performed by Analyse-it, with no Excel formulas and no third-party functions. The calculations are validated against the NIST Statistical Reference Datasets, CLSI reference datasets and thousands of internal test cases. That validation is the basis of the evidence in a 510(k), a CE-IVD technical file, a CAP inspection or an ISO 15189 audit. How Analyse-it is developed and validated →
Try it on your own data first. The 15-day trial is every feature from all five editions — install it and start straight away.
Method Validation edition: US$ 475 per year or US$ 1155 for a perpetual licence. Every purchase carries a 30-day money-back guarantee. Need a quote for purchasing? Choose the licence on the pricing page and click Get a quote.