
A quantitative method is linear over the range where its measured result follows a straight line against the true concentration. Equal steps in concentration should produce equal steps in the reading, whatever the starting point. That range is the interval over which you are entitled to report numbers. Outside it, results curve away from the truth and mislead.
Establishing the linear range is the subject of CLSI EP06-Ed2. A high correlation coefficient is a common shortcut, but it does not do the job, for much the same reason it fails in method comparison.
Linearity is assessed with a series of samples of known relative concentration spanning the claimed measuring interval. Typically you mix a high and a low pool in known proportions, or use dilution. Measure each level in replicate. The levels should reach the ends of the interval and space out across it. Nonlinearity most often appears at the extremes: saturation at the top, or a disproportionate response near the bottom. Too few levels, or levels clustered in the middle, leave the regions where curvature hides unexamined.
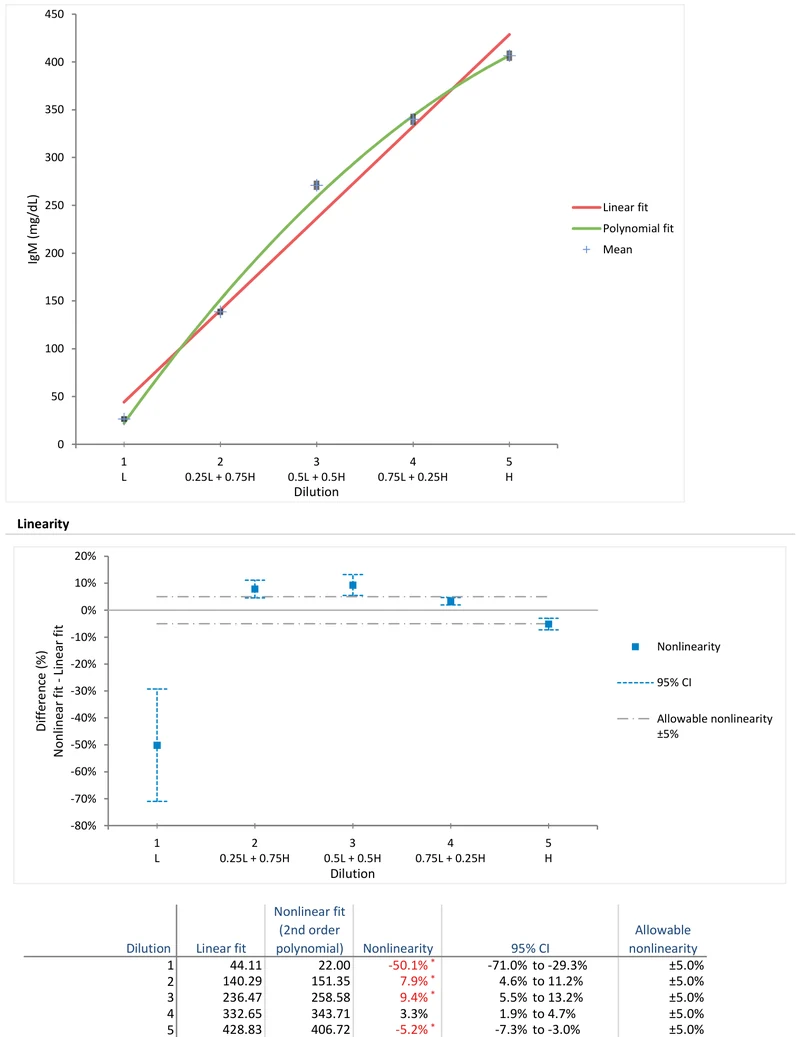
The quantity that matters is the deviation from linearity at each level: how far the measured response departs from a straight line fitted through the data. EP06-Ed2 takes the deviation as the difference between the mean result at each level and the straight line. The earlier EP06-A fitted second- and third-order polynomials as well, and took the difference between the best-fitting curve and the line. That polynomial approach is still widely used. A straight-line fit with no comparison of this kind cannot expose curvature, because it draws a line through curved data and leaves the curvature in the residuals.
Judge the deviation from linearity at each level against an allowable nonlinearity, not against zero, because statistical significance is not the same as clinical importance. A large enough study will flag a trivial, clinically irrelevant curvature as significant.
The allowable nonlinearity is a criterion set from clinical or analytical requirements, often expressed as a percentage. Use an equivalence test rather than a test against zero. A difference plot of each level’s deviation against the allowable band makes the judgement immediate. Where the deviations sit inside the band, the method is linear enough; where they fall outside it, the method is not.
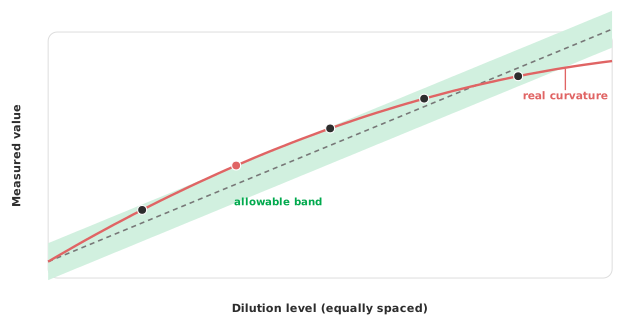
The output is not a single pass or fail for the whole range but the interval over which the method is linear within the allowable nonlinearity. If the extremes deviate but the middle holds, the measuring interval is narrower than claimed. Results outside it should be diluted into range or flagged. The calcium linearity workbook shows exactly this pattern. Over the full interval, five of the six dilutions exceed the ±0.2 mg/dL allowable nonlinearity. A refit over a reduced interval passes at every level, and that reduced interval is the one to report.
Two worked examples, ready to open in the Analyse-it trial:
The example workbook is downloading.
It opens in Excel on its own — the data and the finished results are both in it. Analyse-it is what lets you change the analysis and re-run it, try the same study on your own data, or work through it to see how the software handles it.
Every feature from all five editions for 15 days.
Using a correlation coefficient or R² as the test. Both can look excellent while the data curve. Fit polynomials and judge the deviation from linearity against an allowable limit.
Too few levels, or none at the extremes. Curvature hides where you did not sample. Span the interval and reach its ends.
Reading statistical significance as clinical significance. A large study flags trivial curvature. Judge the deviation against an allowable nonlinearity, not against zero.
Treating linearity as a one-off. A linearity study establishes the interval when the method is introduced. Under the CAP checklists, recurring AMR verification then checks every six months that the interval still holds.
Confusing linearity with calibration. A linearity study asks whether the response stays on a straight line across the interval. A calibration curve is the fitted relationship you invert to report results. See fitting a calibration curve.
Reporting outside the linear interval. If the extremes fail, the measuring interval is narrower than claimed. Dilute into range or flag. Do not report numbers the method cannot support.
Analyse-it runs the linearity assessment on your own dilution series, inside Excel:
Every feature from all five editions for 15 days. Linearity is in the Method Validation and Ultimate editions, from US$ 475 a year. Validated against NIST and CLSI reference datasets. The linear interval established here is the basis of the analytical measuring interval and reportable range. Full detail in the trueness and linearity reference guide.