
The analytical measuring interval is the span a method measures directly, without dilution, and the reportable range is that span extended by a validated dilution. Both start at or above the limit of quantitation, so the three stack from the bottom up. The terms are often used loosely, so a validated range on one document can mean something different on the next.
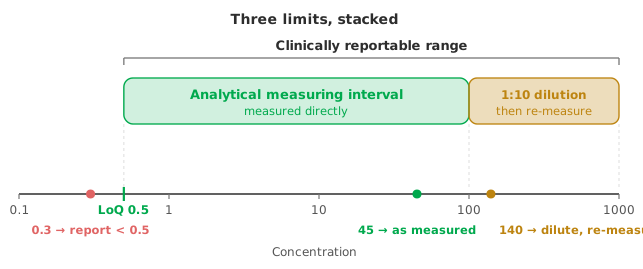
The limit of quantitation (LoQ) is the lowest concentration the method measures with stated precision and bias, and so the lowest at which you can report a number. The lowest concentration you can distinguish from zero is a different and lower limit, the limit of detection. The LoQ is established from a detection-capability study (EP17), and it anchors everything above it. No reportable interval can begin below the concentration at which the method stops being trustworthy.
The analytical measuring interval (AMI) is the span over which the method measures the analyte directly, with no dilution or concentration. Across the whole of that span the method still meets its allowable error. The interval goes by several names. Analytical measurement range (AMR) is the term the CAP checklists use, and analytical measuring range is a common variant. “The linear range” is loose shorthand for the same thing. All of them mean the interval the method may report without dilution.
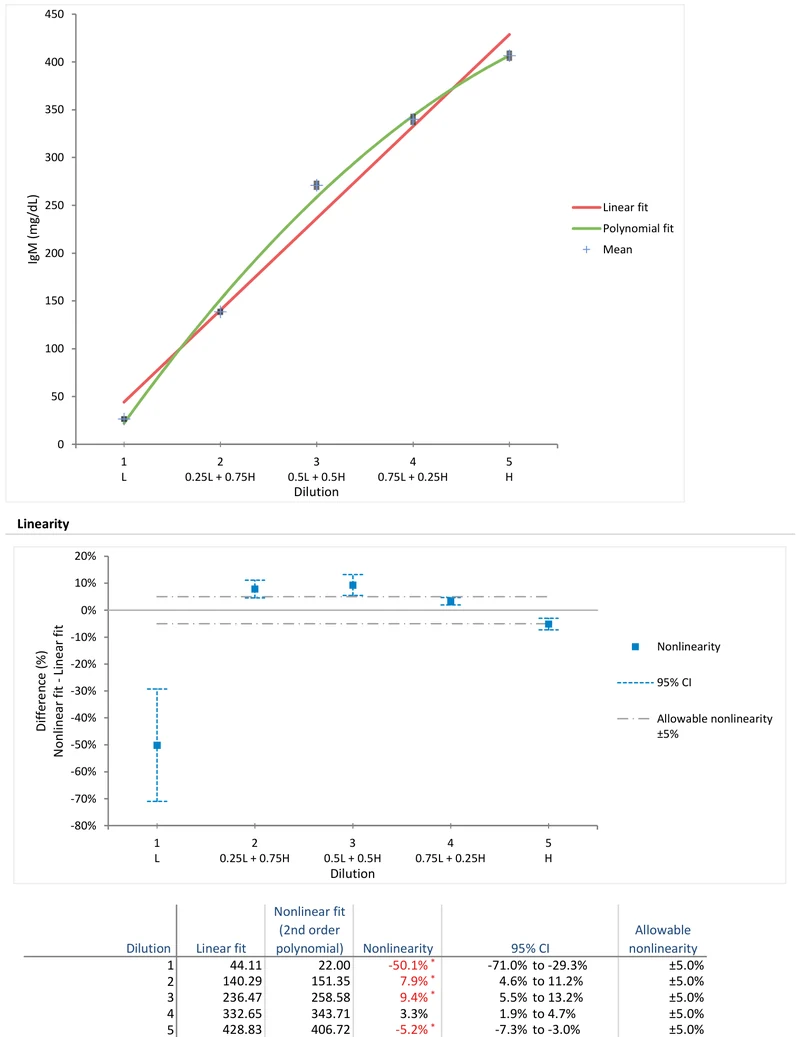
The lower bound of the AMI is the higher of the LoQ and the lowest concentration that stays on the linear relationship. The upper bound is the highest concentration at which the response stays linear and accurate. The AMI is established from a linearity study (EP06-Ed2). Fit the response across a set of levels and judge the deviation from linearity against an allowable nonlinearity; the AMI is the interval over which the method passes.
The clinically reportable range (CRR) is the AMI extended by validated sample handling. Dilution extends it upwards and, occasionally, concentration extends it downwards. A result above the AMI is not reported as measured: the sample is diluted by a validated factor, re-measured inside the AMI and multiplied back up. The CRR is therefore only as trustworthy as the dilution protocol behind it. An assay is reportable to 1000 only if a recovery study has shown that the 1:10 dilution recovers the analyte accurately; dividing by ten is not enough.
Three ranges appear on the same report and mean quite different things. Two describe the method. One describes the patients.
| Range | What it describes | Where it comes from |
|---|---|---|
| Analytical measurement range (AMR, or measuring interval) | What the method measures directly, without dilution | A linearity study (EP06) |
| Clinically reportable range (CRR) | The AMR extended by a validated dilution | A recovery study on the dilution factor |
| Reference interval (the “normal range”) | The results a healthy reference population gives | A reference interval study on real subjects (EP28) |
The first two are properties of the instrument and the assay, and say nothing at all about health. The reference interval is a property of the population, and it usually sits well inside the AMR. A potassium result of 6.8 mmol/L is comfortably inside the measurement range and comfortably outside the reference interval. Such a result is exactly why the two must never be conflated on a report. See choosing a reference interval method for how the third one is established.
Suppose a detection-capability study puts the LoQ at 0.5 µg/L. Suppose too that a linearity study shows the response stays linear and within the allowable nonlinearity band from 0.5 up to 100 µg/L. The AMI is 0.5–100 µg/L. A recovery study then validates a 1:10 dilution, extending the CRR to 1000 µg/L.
The reporting rules then follow directly. A sample reading 45 is reported as measured. A sample reading 140 is above the AMI, so it must be diluted and re-measured rather than reported directly. A sample reading 0.3 is below the LoQ and is reported as “< 0.5”, never as 0.3.
State all three limits, not one range. Record the LoQ and the study that set it. Record the AMI and the linearity evidence for it. Record the CRR together with the dilution factor and the recovery data that justify it. A result reported outside the AMI without a validated dilution behind it is the kind of finding an inspection will raise.
Two worked examples, ready to open in the Analyse-it trial:
The example workbook is downloading.
It opens in Excel on its own — the data and the finished results are both in it. Analyse-it is what lets you change the analysis and re-run it, try the same study on your own data, or work through it to see how the software handles it.
Every feature from all five editions for 15 days.
Reporting below the LoQ. A number the method cannot quantify reliably should be reported as below the limit, not as its face value. Suppressing the LoQ censoring rule puts unreliable low results into the record.
Calling the measurement range the reportable range. The AMR is what you measure directly. The CRR extends it only where a dilution has been validated. The two are not the same span and should not share a number.
Diluting without a recovery study. A dilution factor is an assumption until recovery data confirm the analyte comes back accurately at that dilution. Validate the factor before you rely on it.
Verifying the interval once. The AMI is established when the method is introduced, but under the CAP checklists it is re-verified on a recurring cycle. See CAP accreditation and AMR verification.
Letting the AMI start below the LoQ. The measuring interval cannot begin at a concentration the method cannot quantify. The LoQ is the floor.
Analyse-it sets both ends of the interval from your own data, inside Excel:
Every feature from all five editions for 15 days. Linearity and detection capability are in the Method Validation and Ultimate editions, from US$ 475 a year. Validated against NIST and CLSI reference datasets. See LoB, LoD and LoQ explained for the lower limits.