Every feature from all five editions for 15 days.
Method Validation edition from US$ 475 a year · 30-day money-back guarantee.
Most of what a clinical laboratory does statistically is verification. The manufacturer has already established the performance claims. Your job is to demonstrate that you reproduce them in your hands, on your analysers, with your staff and your patient population. A verification is a much smaller study than the one the manufacturer ran. The study still has to be done before you report a result, repeated when something changes and evidenced when an inspector asks.
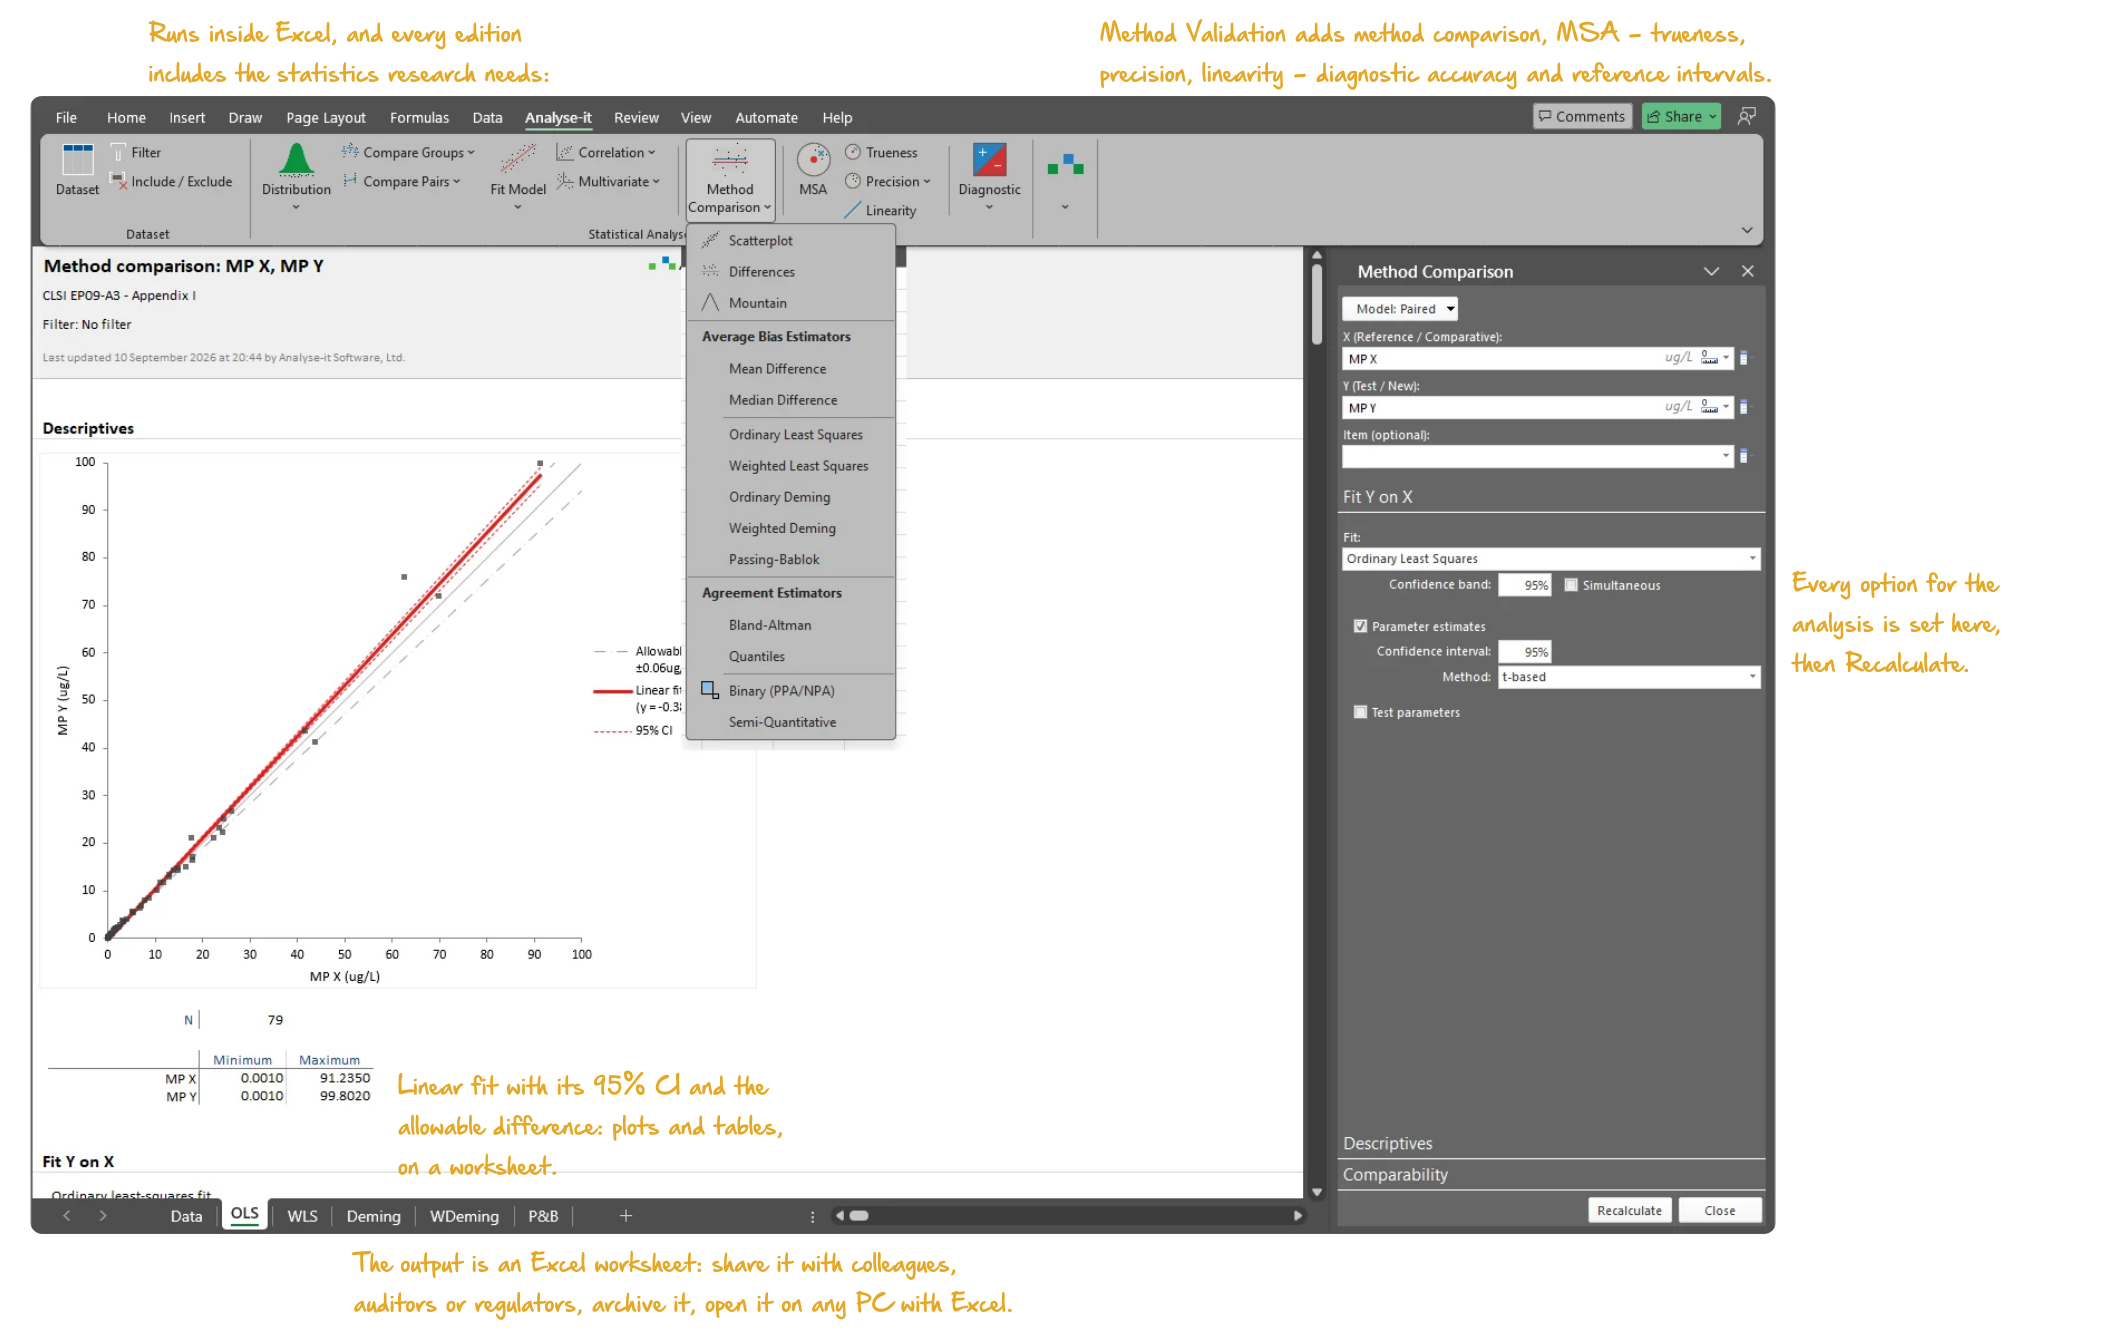
The awkward part is rarely the statistics. The difficulty is that the requirement lives in one document, the acceptance limit in another and the calculation in a spreadsheet somebody built years ago. Analyse-it runs every one of these studies directly in Excel, so the analysis, the data and the record are one workbook. The workbook is one you can hand to an assessor, archive and reopen in three years when the same question comes back. Follow a CLSI protocol exactly where that is what your accreditation body expects, or design the study to suit your method and use the statistics directly. The software does not decide that for you.


The requirements below are the ones that come up in almost every accredited laboratory. Each links to a guide covering how the study is designed, how to set the acceptance limit and what usually goes wrong. The guides are useful whichever software you end up using.
| What you must show | The study | Typically required by | Guide |
|---|---|---|---|
| Precision | Short replication study tested against the claimed imprecision (EP15-A3) | CLIA, CAP, ISO 15189 | Verifying a precision claim |
| Trueness or accuracy | Comparison against a reference or comparative method, with bias at the decision points | CLIA, CAP, ISO 15189 | Bias at a decision point |
| Reportable range — the AMR | Linearity across the claimed interval, repeated every six months under CAP | CLIA, CAP | AMR verification |
| Reference intervals | Transfer the manufacturer’s interval and verify it with a binomial test on a small sample (EP28-A3c) | CLIA, CAP, ISO 15189 | Transferring a reference interval |
| Analytical sensitivity — LoB, LoD, LoQ | Only if you modified the method or it is laboratory-developed (EP17-A2) | CLIA, for modified and LDT methods | LoB, LoD and LoQ explained |
| Analysers agreeing with each other | Difference study between instruments running the same method, twice a year | CAP | Comparing instruments |
| The method staying in control | Daily internal QC on Levey-Jennings charts with a rule set | CLIA, ISO 15189 | Levey-Jennings charts |
| Measurement uncertainty | Built top-down from the imprecision and bias your verification already produced | ISO 15189 | Top-down uncertainty |
Not sure which of these apply to your laboratory? What CLIA requires before you report a result works through the two lists in 42 CFR 493.1253 and which one applies to your method.
An unmodified FDA-cleared assay run exactly as the manufacturer intends needs four characteristics verified. Modify it — a different sample type, a different matrix, an off-label specimen — and it becomes laboratory-developed. The second CLIA list then applies, and you are establishing performance rather than confirming it. Laboratories routinely discover this after the study is finished and the paperwork is written.
The distinction is not about how careful you are, and it is not negotiable at inspection. Validation versus verification sets out how to tell which one you are on, and verifying a manufacturer’s precision claim covers the difference in study design that follows from it.
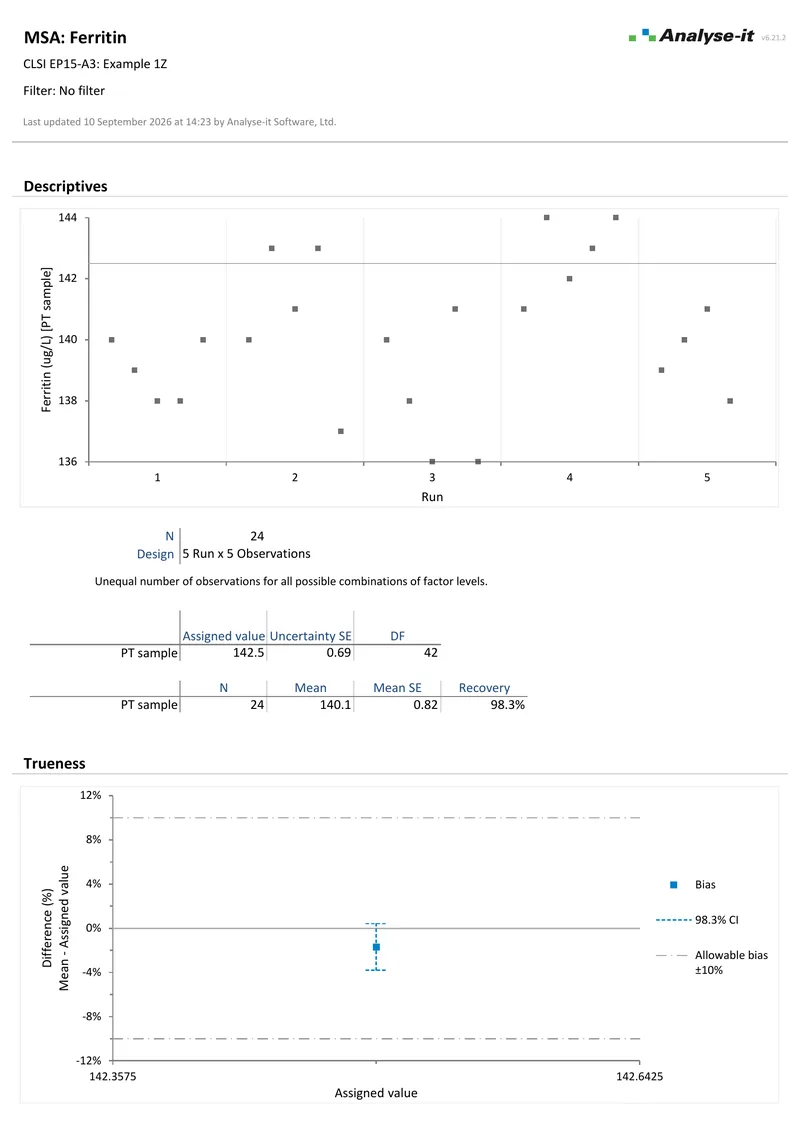
The EP15-A3 verification is deliberately small — typically five days, five replicates, two or three concentrations — which is exactly why the statistics matter. With that few observations, a point estimate of imprecision that merely looks smaller than the claim proves very little. The protocol tests the observed imprecision against the claim rather than judging it by eye, and lets you estimate bias from the same runs rather than mounting a second study.
Analyse-it runs the verification as one analysis: within-run and total precision with χ² tests against the manufacturer’s claimed imprecision, and trueness against assigned values at the same time. When a verification fails, the output separates the run-to-run component from the replicate scatter. That separation is usually what tells you whether the problem is the method, the operator or the material.
Precision and trueness in detail →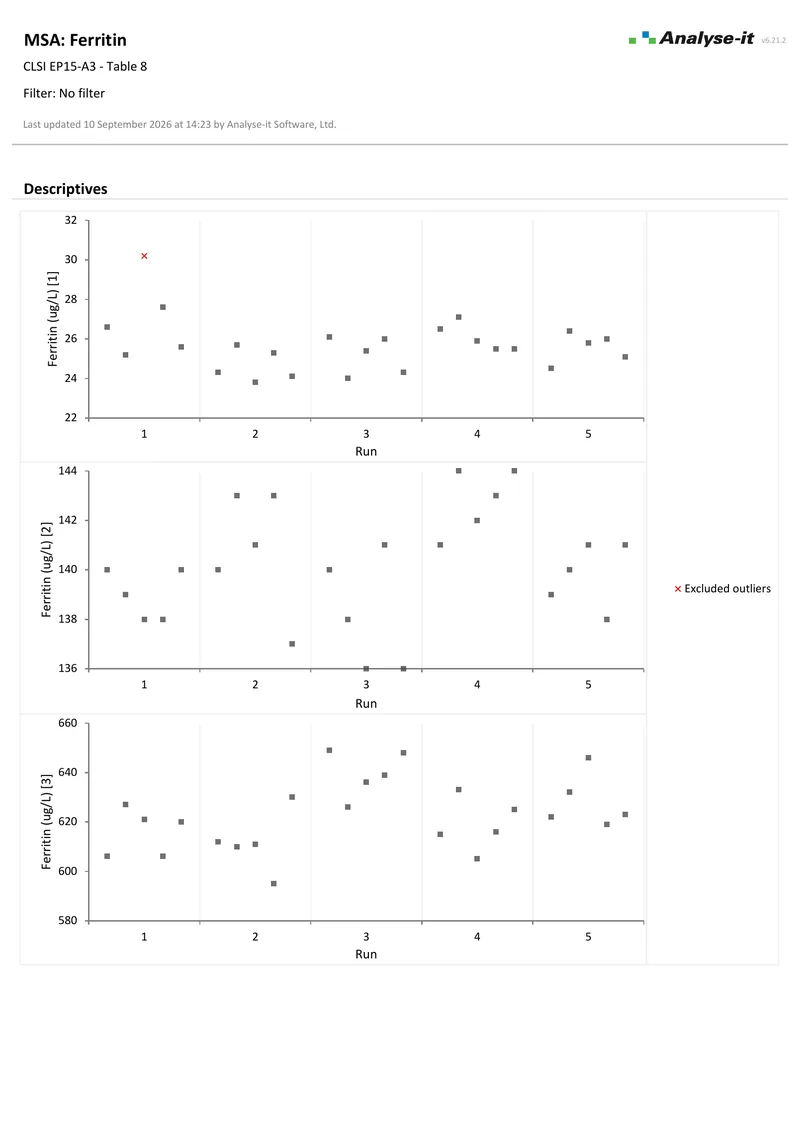 3 pages
EP15-A3 — Table 8
3 pages
EP15-A3 — Table 8AMR verification and calibration verification answer different questions, yet they are conflated more often than any other pair of studies in the CAP checklists. Calibration verification asks whether the analyser still reads correctly at the calibration points. AMR verification asks whether the response stays linear across the whole claimed interval. Only the AMR verification tells you what you may report without dilution.
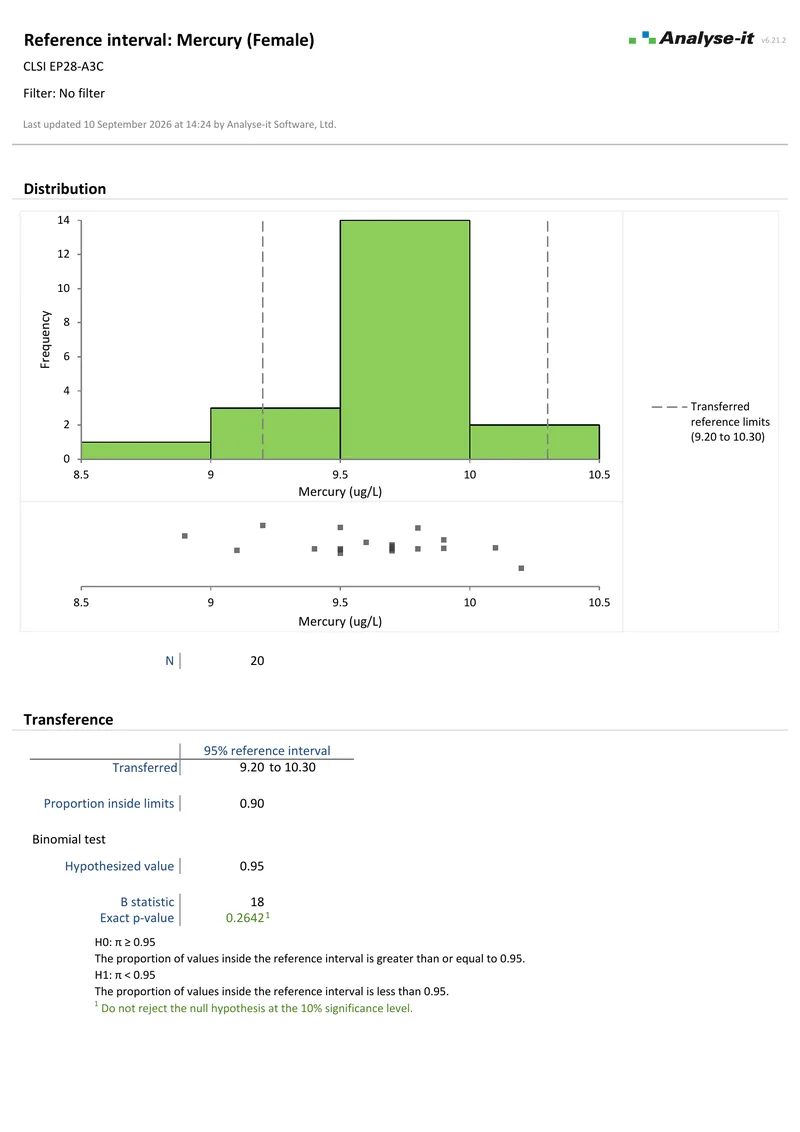
For reference intervals, transferring the manufacturer’s is usually defensible and far cheaper than recruiting a reference population. Transference is still a study with a result, not an assumption. Analyse-it verifies a transferred interval with the binomial test on a small sample per EP28-A3c. Intervals can also be estimated outright, partitioned by sex or age, where the transfer does not hold.
Linearity and measuring interval → Reference intervals →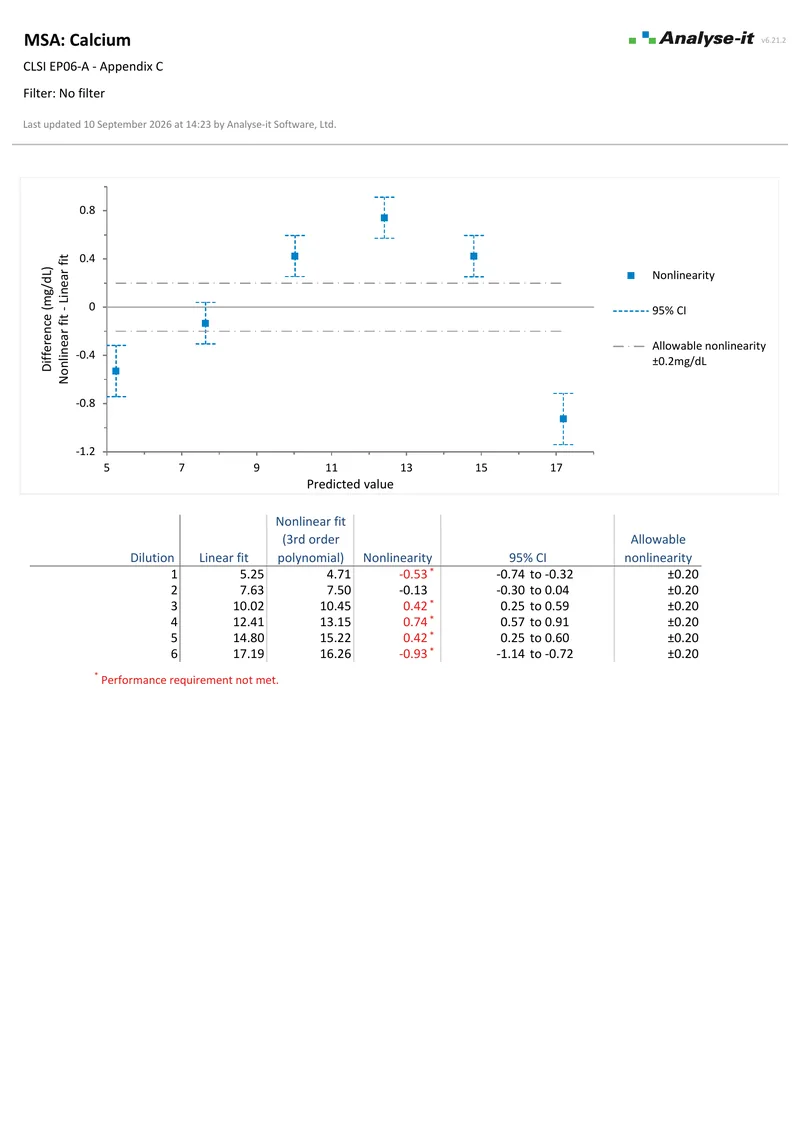 6 pages
EP06-A — Appendix C
6 pages
EP06-A — Appendix CTwo analysers running the same method on the same bench is not a method comparison. Treating it as one is the most common analytical error in accreditation work. No reference method exists here, neither instrument is “right”, and fitting a regression to decide which is biased answers a question nobody asked. What matters is the size and spread of the differences, judged against a limit you set before you looked at the data.
Analyse-it produces the difference plot, mean and median bias with confidence intervals, and limits of agreement, each judged against the allowable difference you set. This output is the evidence the CAP twice-yearly comparison asks for.
Agreement and difference plots → 2 pages
EP09-A3 — Appendix I
2 pages
EP09-A3 — Appendix IA verification is a snapshot. What protects patient results for the rest of the year is the internal QC chart. What makes the chart work or fail is the rule set. Too few rules and a slow reagent drift runs for weeks before a point crosses a limit. Too many and staff learn to dismiss the flags, which is worse than having none.
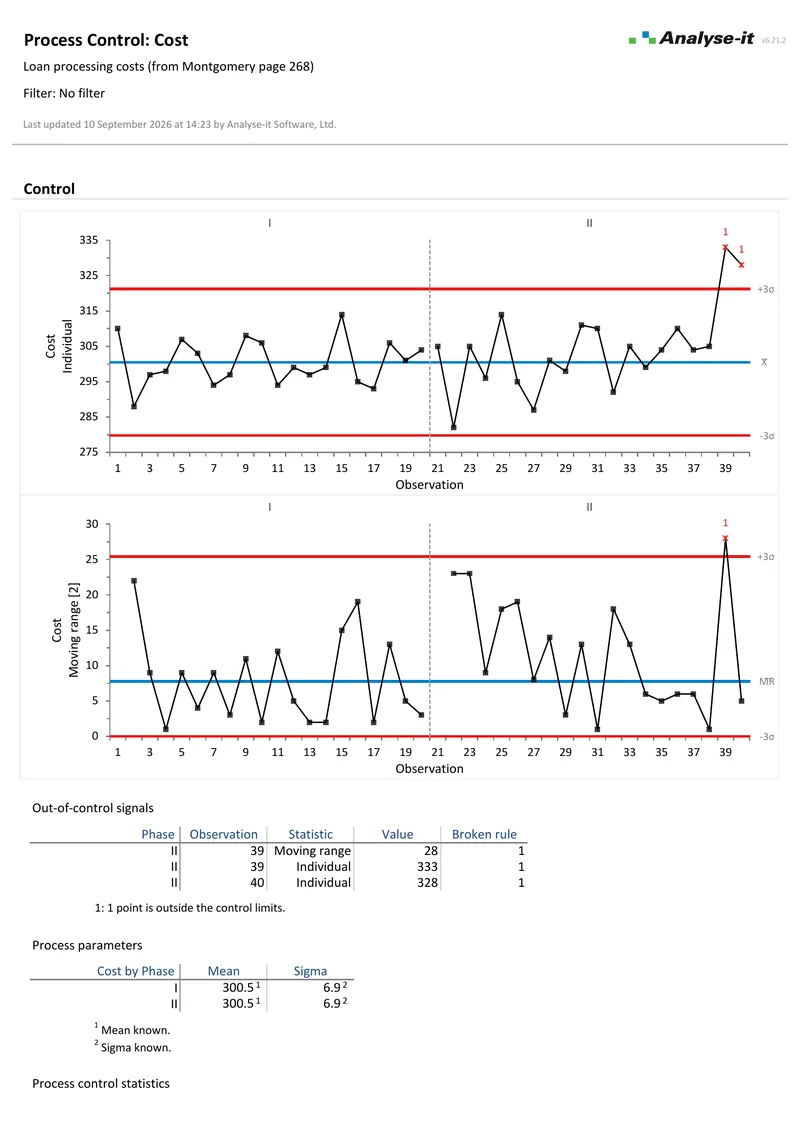
Levey-Jennings charts are Shewhart individuals charts with clinical labelling. Analyse-it draws them with the same detection rule sets, phases before and after a lot change, and stratification by analyser or shift. Where a drift is small and sustained rather than sudden, CUSUM and EWMA catch it earlier than any Shewhart rule will. Reading out-of-control signals covers how to tell a real shift from the false alarms any rule set produces.
Control charts and detection rules →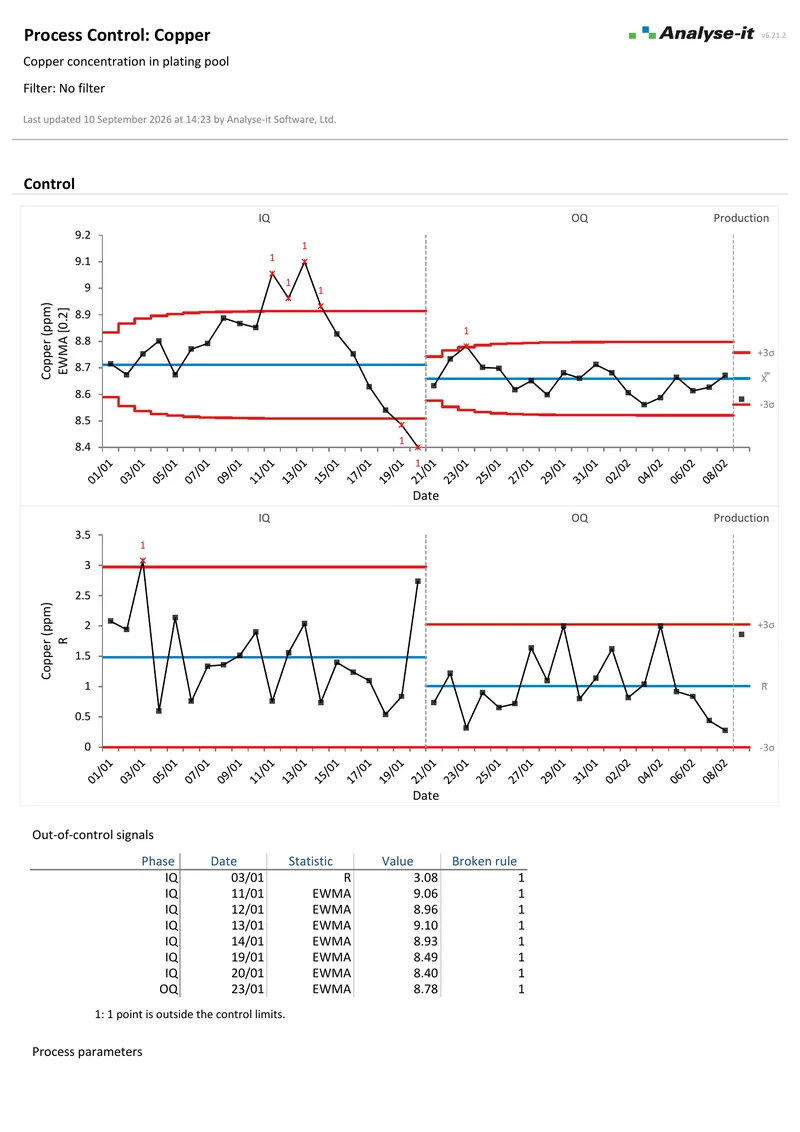 6 pages
Shewhart, EWMA and CUSUM
6 pages
Shewhart, EWMA and CUSUMNone of the regulations set your numbers. CLIA names the characteristics you must verify; CAP tells you how often; ISO 15189 requires that you have criteria and apply them. Choosing the limit is the laboratory’s job. That choice is also the one most often made after the data has been collected — which is precisely when it stops being defensible.
The Milan hierarchy is the usual starting point. The hierarchy runs from clinical outcome where the evidence exists, through biological variation where it does not, to the state of the art as the fallback. From there, allowable total error and total error versus measurement uncertainty cover the two competing ways of combining imprecision and bias into one number you can test against.
For ISO 15189 laboratories, the uncertainty estimate does not need a new study: the top-down approach builds it from the imprecision and bias your verification has already produced.
The verification studies above are the Method Validation edition. That edition holds precision and trueness against a claim, method and instrument comparison, linearity and the AMR, detection limits and reference intervals. Daily internal QC on Levey-Jennings charts is the Quality Control & Improvement edition, and Ultimate holds both in one licence.
Every edition includes the full Standard edition statistics, and the comparison table lists every analysis against every edition. Volume pricing is available for laboratory networks.
Every calculation is performed by Analyse-it — no Excel formulas and no third-party functions. The calculations are validated against the NIST Statistical Reference Datasets, CLSI reference datasets and thousands of internal test cases. That validation is the basis of the evidence you show at a CAP inspection or an ISO 15189 audit. Analyse-it runs entirely within Excel on your PC, so patient data never leaves the laboratory, and results are ordinary workbooks an assessor can open without a licence. The workbooks carry no formulas, so what you reported is what you find when you reopen the file. How Analyse-it is developed and validated →
Try it on your own data first. The 15-day trial is every feature from all five editions — install it and start straight away.
Method Validation edition: US$ 475 per year or US$ 1155 for a perpetual licence. Every purchase carries a 30-day money-back guarantee. Need a quote for purchasing? Choose the licence on the pricing page and click Get a quote.