
A clinician reading a patient record treats the results as one series. The clinician does not know, or need to know, whether the laboratory used one analyser or several, at one site or at several across a health system. A creatinine from Tuesday on one instrument and a creatinine from Thursday on another are compared directly. A change between them is read as a change in the patient. That reading is only safe if the instruments agree closely enough that any difference between them is clinically invisible.
Verifying that the instruments agree is a distinct study with its own guideline. CLSI EP31 covers verification of comparability of patient results within one health care system. Accreditation programmes generally require it periodically. Under the CAP checklists, instruments or methods measuring the same analyte are checked against each other at least twice a year.
The instinct is to use the method comparison analysis, and it is the wrong tool for reasons that matter.
A method comparison asks how a new measurement procedure relates to a comparative one. The two methods are genuinely different and may have a constant or proportional bias between them, so the job is to characterise that relationship. A method comparison therefore reports a fitted regression, a slope and an intercept, and the bias estimated at each decision point.
A comparability check asks something narrower: do two instruments running the same method still give the same answer? Here the expected relationship is identity, not something to be estimated. Neither analyser is a reference, and neither is entitled to be called correct. You want to know the size of the difference between them and whether it is small enough to ignore. Fitting a regression to answer that adds parameters you do not need. Worse, it encourages reporting a slope of 1.02 as though it were a finding, when the question was whether any patient would be misled.
EP31 also assumes the fuller evaluation has already been done, at the point the instruments were introduced. The recurring check confirms that what was established then still holds.
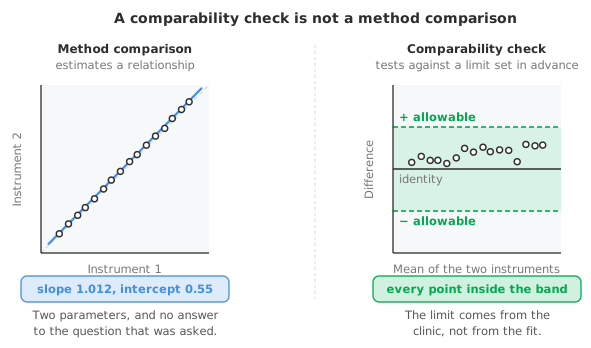
Run the same samples on each instrument and work with the paired differences. For two instruments that is the difference per sample. Across several instruments, the range of results for each sample (the largest value minus the smallest) is the natural summary. EP31 takes this approach for a modest number of instruments.
Plot the differences against concentration rather than reading a single average. An average difference of zero is entirely compatible with two instruments that disagree substantially at the low end and disagree in the opposite direction at the high end. The difference plot is the right display, with one change of emphasis. Here you are not describing the limits of agreement so much as asking whether every point sits inside a limit you set in advance.
Judge the differences against the method’s own imprecision as well as against the clinical limit. Two instruments will never return identical numbers. A difference no larger than repeatability alone would produce is not evidence of an instrument offset. Such a difference is the measurement noise you already knew about. A real offset shows as a difference that persists across samples in the same direction, larger than repeatability accounts for.
Use patient samples where you can. Processed or artificial materials may not behave in the method the way patient specimens do. A difference measured on non-commutable material tells you about the material rather than about the instruments, the same commutability trap that undermines a method comparison.
Spread the concentrations across the measuring interval. Place samples deliberately near the clinical decision points, because that is where a difference between instruments changes what happens to a patient. A comparability study run entirely on mid-range samples verifies the part of the range where disagreement matters least.
The acceptance criterion decides the outcome of the study, and it is yours to set and justify. The criterion should come from what a difference would do clinically, not from what the instruments are observed to do. Suitable sources are an allowable total error figure or a specification derived from biological variation. A limit set from observed scatter will be met by any pair of instruments, including a pair that disagree badly.
The limit for comparability is often set tighter than the limit for a method comparison when the method is introduced. Two instruments running the same method are expected to agree more closely than two different methods.
A failed check is the start of an investigation, not a conclusion. First ask whether the difference is real. Repeat with fresh samples before acting, since a single set can be spoiled by a handling error or an outlier. If the difference persists, it is either a correctable calibration difference or a genuine repeatable bias between the systems.
Where the difference cannot be removed, the remaining options concern how results are reported. Separate them by instrument, or flag which system produced a result, so that a clinician does not read an instrument change as a patient change. The reporting decision is clinical rather than statistical, and it belongs with the laboratory director.
Run the same check outside the routine cycle after anything that could move one instrument relative to the others. The triggers include a component change, major maintenance and a reagent lot change. A quality control or external quality assessment signal on one system but not the others is a trigger too.
Download the CLSI EP09-A3 example workbook (.xlsx) — difference plots against the mean of the two methods, with the mean difference, its confidence interval and an allowable band, ready to open in the Analyse-it trial.
The example workbook is downloading.
It opens in Excel on its own — the data and the finished results are both in it. Analyse-it is what lets you change the analysis and re-run it, try the same study on your own data, or work through it to see how the software handles it.
Every feature from all five editions for 15 days.
Running a comparability check as a method comparison. Reporting a slope and intercept for two instruments running the same method answers a question nobody asked. Work with the differences and compare them against a pre-set limit.
Nominating one instrument as the reference. Neither is the truth. Designating a primary analyser is a practical convenience for organising the comparison, not a statement that its results are correct.
Reading the mean difference alone. Offsets that reverse across the range average to nothing. Plot the differences against concentration.
Comparing at the wrong concentrations. The middle of the range is the least useful place to demonstrate agreement. Include the decision points.
Setting the acceptance limit afterwards. The limit has to exist before the data, and has to come from a clinical requirement rather than from the observed differences.
Analyse-it estimates the difference between instruments on your own split samples, inside Excel:
Every feature from all five editions for 15 days. The difference plot and Bland–Altman agreement are in the Medical, Method Validation and Ultimate editions, from US$ 340 a year. The method comparison regression fits are in the Method Validation and Ultimate editions only, from US$ 475 a year. Validated against NIST and CLSI reference datasets. For the accreditation requirement this study answers, see CAP accreditation and AMR verification; for the studies before a method goes into use, what CLIA requires before you report a result.