
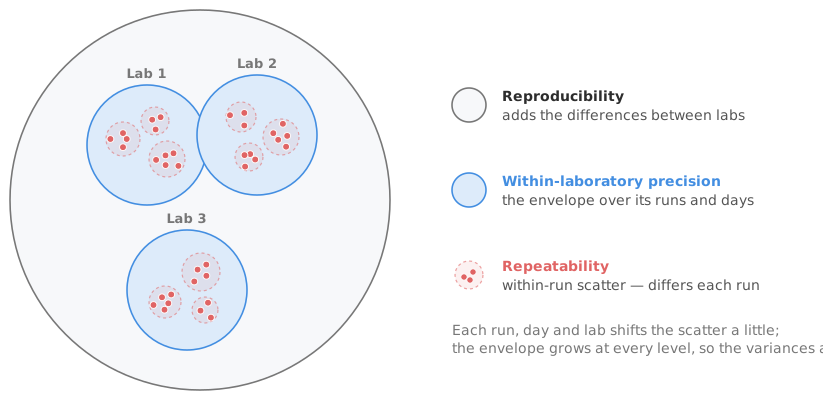
“Precision” is not one number. Measure the same sample twice in a single run and the results differ a little. Measure it across runs, days, instruments and laboratories and the results vary more at each level. The levels are distinct, they nest inside one another, and each has a name: repeatability, intermediate precision and reproducibility. Separating them is the variance-components step at the centre of a measurement system analysis. The names get used loosely and often wrongly. Quote the wrong one and you either make the method look better than it is or overstate its variation.
Repeatability, or within-run precision, is the variation between replicates measured under conditions kept as constant as possible: the same run, operator, calibration and reagents, close together in time. Repeatability is the irreducible short-term noise of the measurement. Of the precision figures it is the smallest, the one that looks best on a specification sheet and the least representative of real use. No result you report next week was measured in the same run as the one you reported today.
Between successive runs, and between days, further sources of variation appear: recalibration, reagent ageing, environmental drift and a change of operator. These between-run and between-day components sit on top of repeatability. Neither is usually reported on its own. Both feed into the level above, which is the one that describes real laboratory use.
Within-laboratory precision, called intermediate precision in the ICH and pharmaceutical literature, combines repeatability with the between-run and between-day variation. The result is the total spread a single laboratory sees over time, and it is the figure to report for routine results. Within-laboratory precision answers the question “how much might this patient’s result differ if the same sample were measured next Tuesday?” Whenever a method’s precision is quoted for clinical use, this is almost always the right number. Not the more favourable repeatability.
Reproducibility adds the variation between laboratories, instruments or sites on top of within-laboratory precision. Reproducibility is the broadest figure, describing how much results vary everywhere the method is used. That breadth makes it chiefly the manufacturer’s concern for a product shipping to many sites. The order always holds: repeatability ≤ within-laboratory precision ≤ reproducibility. Each level includes every source of variation below it and adds at least one more.
Precision components combine on the scale of variance (the square of the standard deviation), not on the scale of the standard deviation itself. Within-laboratory variance is the sum of the repeatability variance and the between-run and between-day variances. The within-laboratory SD is the square root of that sum.
You cannot add standard deviations. You certainly cannot add coefficients of variation to combine precision levels. A repeatability SD of 3 and a between-day SD of 4 give a combined SD of 5 (because 3² + 4² = 5²), not 7. Adding the SDs directly overstates the combined imprecision, sometimes badly.
Each component can be expressed as a standard deviation (absolute, in the analyte’s units) or a coefficient of variation (relative, as a percentage of the mean). Use the SD when the scatter is roughly constant across the range. Use the CV when the scatter grows in proportion to concentration, which is the common case. A constant CV is often a better description of a method than a constant SD.
Specifications and precision goals are frequently stated as a CV for exactly this reason. Whichever you report, be explicit about which precision level it belongs to. “CV = 4%” means very different things as a repeatability figure and as a within-laboratory one.
Download the precision example workbook (.xlsx) — a single-site glucose study (dataset from CLSI EP05-A2 Appendix B, 20 days × 2 runs × 2 replicates) with repeatability and within-laboratory precision separated by variance component analysis, ready to open in the Analyse-it trial.
The example workbook is downloading.
It opens in Excel on its own — the data and the finished results are both in it. Analyse-it is what lets you change the analysis and re-run it, try the same study on your own data, or work through it to see how the software handles it.
Every feature from all five editions for 15 days.
Quoting repeatability as the method’s precision. It is the smallest and least representative figure. For reported results, quote within-laboratory precision, not repeatability.
Adding standard deviations to combine levels. Variances add; SDs do not. Combine on the variance scale and take the square root.
Using a nested design for a crossed question. Nested components separate sources that sit inside one another. Where factors are deliberately varied against each other, the design is crossed and the analysis is a multi-factor model. See robustness testing.
Reporting a precision without its level. A bare CV is ambiguous. State whether it is repeatability, within-laboratory precision or reproducibility.
Assuming a constant CV or SD without checking. Precision usually varies across the range. A precision profile tells you which description fits.
Analyse-it partitions the variance on your own data, inside Excel:
Every feature from all five editions for 15 days. Precision is in the Method Validation and Ultimate editions, from US$ 475 a year. Validated against NIST and CLSI reference datasets. Full detail in the precision reference guide, or see establishing precision for the study design.