
Total analytical error (TAE) and measurement uncertainty (MU) both combine bias and imprecision into one number that summarises how wrong a result might be. Both use the same two ingredients, so they are often treated as interchangeable, but they combine those ingredients differently and describe different things. Choosing between them is really a choice about how you conceive of a result’s error.
The total analytical error model asks a blunt, practical question: how far off could a single result be, at worst? The model adds bias to a multiple of the imprecision, so that bias plus 1.65 or 1.96 standard deviations bounds the error of about 95% of individual measurements. Bias and imprecision are treated as acting in the same direction, because for one result on one day they might. The output is a one-sided 95% limit on the error of a single result. Compare it against an allowable total error to decide whether the method is fit for a clinical decision.
With a bias of 1.0% and an imprecision of 2.0%, the total error at 1.65 SD is 1.0% + 1.65 × 2.0% = 4.3%. The 4.3% is the figure to set against the allowable limit. CLSI EP21 formalises estimating total error from a comparison study.
Measurement uncertainty asks a different question: given this reported value, over what interval could the true value reasonably lie? The framework assumes known biases have been corrected, then characterises the remaining dispersion. The uncertainty of that correction combines with the imprecision in quadrature, as independent variances, to give a symmetric ±U interval around the result. Measurement uncertainty is therefore a statement about the value’s spread, expressed with a stated coverage, and it is what ISO 15189 and the metrological tradition ask for.
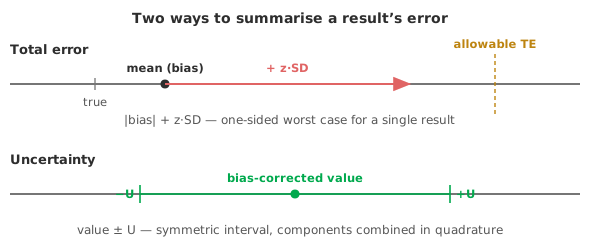
The two can give materially different figures from the same validation data. Each is right for its own purpose.
The total-error view, judged against an allowable limit, is the natural test when the question is whether a single result could mislead a treatment choice. The same view underlies method decision charts and Sigma metrics.
Measurement uncertainty is the right instrument when a result must carry an interval that expresses how well the value is known, in the sense an accreditation body expects. Treating one as a direct substitute for the other is where the confusion, and the arguments, come from.
In practice, laboratories often need both, for different audiences. The pragmatic position: use total error against an allowable limit to decide whether a method is good enough for its clinical purpose. Use measurement uncertainty to state, on a report or under accreditation, how well a given result is known. Whichever you quote, name it explicitly. A single “±” figure with no framework attached is ambiguous. The reader cannot tell whether bias was added or corrected, or whether the interval is a 95% limit on error or a dispersion.
Treating TAE and MU as the same number. One adds bias, the other corrects it; one is a 95% limit on error, the other is dispersion. They will differ, and both can be correct.
Adding components when you should combine in quadrature, or the reverse. The total-error model adds; the uncertainty model takes the square root of the sum of squares. The method must match the framework.
Reporting a bare ± figure. Without naming the framework and the coverage, the interval cannot be interpreted. State which you used.
Using a total-error limit where dispersion is asked for. An accreditation body asking for measurement uncertainty is not asking for allowable total error. Give the quantity requested.
Analyse-it produces what both frameworks need from the same studies, inside Excel:
Every feature from all five editions for 15 days. Total error and the underlying precision and bias estimation are in the Method Validation and Ultimate editions, from US$ 475 a year. Validated against NIST and CLSI reference datasets. See total analytical error explained and estimating measurement uncertainty top-down.