
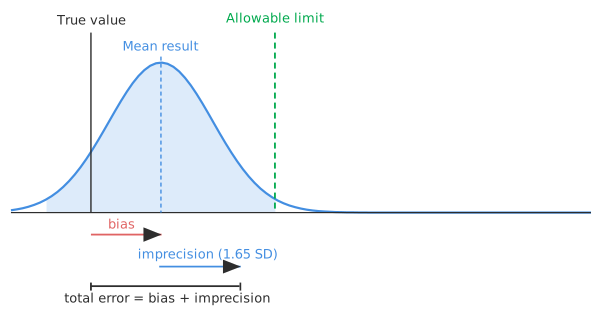
Total analytical error (TAE) is the total amount by which a single result might depart from the truth, combining imprecision and bias into one figure. Precision and bias are usually reported separately, but a single patient result is affected by both at once. The result sits somewhere in the scatter of imprecision, and any systematic bias shifts that whole scatter. Total analytical error is the quantity that ultimately decides whether a method is fit for clinical use, and CLSI EP21 is the protocol for estimating it.
The classical way to think about TAE is a budget. Take the bias, the systematic error, and add an allowance for imprecision: the standard deviation multiplied by a coverage factor.
TAE = |bias| + z × SD
The coverage factor z is 1.65 for a one-sided 95% limit, or 1.96 for a two-sided one. A result could be off by the bias, and then further off by chance up to that multiple of the SD. Together they bound how far about 95% of results can land from the truth. The 95% figure assumes the bias is large enough for the opposite tail to be ignored; with no bias at all, ±1.65 SD covers only 90% of results.
The decomposition is useful for diagnosis. If a method fails, the split tells you whether the cause is imprecision, bias or both.
Building TAE up from separately estimated bias and imprecision assumes you have modelled both correctly and that they combine as the formula supposes. EP21 offers a more direct alternative: measure the total error empirically. Compare the method against a comparative method across patient samples, and look at the distribution of the differences directly. The data are the same differences that a Bland–Altman analysis plots.
The distribution of those differences already contains both the bias, in its centre, and the imprecision, in its spread. The interval that holds the central 95% of the differences estimates the total error a result can carry. No assumption about how the two components combine is needed. The empirical figure is the total error you would actually observe, rather than the one you calculate.
A TAE figure only shows whether the method is acceptable once you compare it against the allowable total error. The allowable total error is the most error you can tolerate before a result could mislead a clinical decision. Where the estimated total error sits inside the allowable limit at the concentrations that matter, the method is fit for purpose. Where it falls outside, the method is not fit for purpose, however good the individual precision or bias looks in isolation.
Precision within spec and bias within spec can still combine into a total error that is not, which is why TAE is the summary figure.
Total analytical error and measurement uncertainty are two frameworks answering closely related questions. Do not conflate them. TAE, in the tradition EP21 comes from, folds bias into the error figure. The measurement-uncertainty framework instead corrects for known bias and expresses the remaining doubt as an interval.
Both aim to bound how far a result may lie from the truth, but they differ in how they treat systematic error. Which your laboratory reports is often set by its accreditation framework. The important thing is to be clear which one a given number is.
Download the CLSI EP21-A total error example workbook (.xlsx) — a sodium method comparison with the total analytical error estimated from the distribution of differences, ready to open in the Analyse-it trial.
The example workbook is downloading.
It opens in Excel on its own — the data and the finished results are both in it. Analyse-it is what lets you change the analysis and re-run it, try the same study on your own data, or work through it to see how the software handles it.
Every feature from all five editions for 15 days.
Reporting precision and bias but never combining them. A result carries both at once. The total error is what determines fitness for use.
Assuming both components can be within spec and the total therefore fine. Precision and bias each inside their limits can still combine into a total error that is not. Check the total.
Quoting a total error without an allowable limit. A TAE figure means nothing on its own. Weigh it against an allowable total error at the relevant concentration.
Mixing the TAE and uncertainty frameworks. One folds bias in, the other corrects for it. Be explicit about which a number represents.
Analyse-it estimates total analytical error per EP21, from your own comparison data, inside Excel:
Every feature from all five editions for 15 days. Total error estimation from the differences is part of method agreement, in the Medical, Method Validation and Ultimate editions, from US$ 340 a year. Validated against NIST and CLSI reference datasets. See allowable total error and Bland–Altman agreement.