
“Sensitivity” is one of the most overloaded words in the laboratory. Applied to detection capability it usually means one of three distinct quantities: the limit of blank, the limit of detection or the limit of quantitation. The three are different numbers, and each answers a different question.
CLSI EP17-A2 defines all three. Reporting one when you meant another is a common and serious error. Be exact about which one you are quoting.
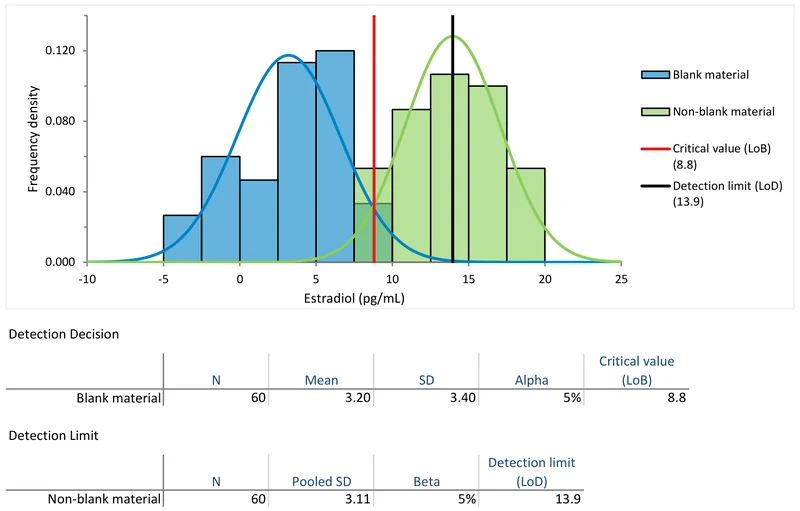
The limit of blank is the highest apparent concentration you expect to see, with 95% probability, when a sample containing no analyte is measured repeatedly. No real measurement system reads a true zero as exactly zero. Noise scatters the blank readings around it, and the LoB captures the upper edge of that scatter.
Estimated parametrically, LoB is the mean of the blank measurements plus a multiple of their standard deviation. The multiple corresponds to the 95th percentile (about 1.645 for a one-sided 95%, adjusted for the number of blanks). Non-parametrically, the LoB is simply the 95th percentile of the blank readings.
The LoB, on its own, does not tell you the lowest concentration you can detect. The LoB only tells you how high a blank can appear to read.
The limit of detection is the lowest analyte concentration that can be reliably distinguished from a blank. The LoD is the concentration at which a sample reads above the LoB often enough that you can call it detected rather than noise. The conventional threshold is 95% of the time.
The classical estimate builds on the LoB: LoD is the LoB plus a multiple of the standard deviation of low-level (non-blank) samples measured near the detection region. The estimate therefore accounts for two sources of scatter: the spread of the blank, and the spread of genuinely low samples. LoD sits above LoB for that reason. The LoD answers a yes/no question: is the analyte present?
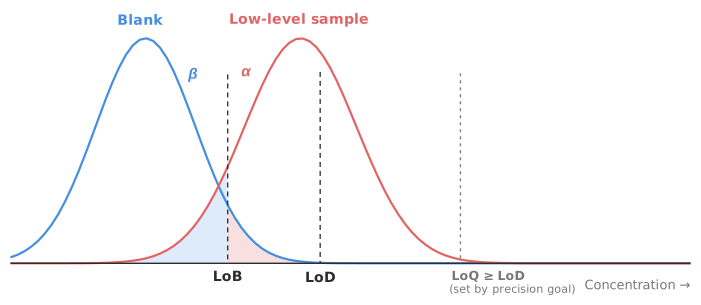
The limit of quantitation is the lowest concentration at which the analyte can not just be detected but measured with a stated, acceptable precision or total error. Detecting that something is present is a lower bar than measuring how much is present to a defined quality, so the LoQ sits at or above the LoD.
The LoQ is defined against a goal you set, often a maximum coefficient of variation (say 20%) or an allowable total error at that concentration. Below the LoQ the analyte may still be detectable, but any number you report for it carries more imprecision than your goal permits. The LoQ answers the quantitative question: how much, and how reliably?
You will also meet the LoQ written as the LLoQ, the lower limit of quantitation, particularly in bioanalysis and pharmaceutical work. The two terms mean the same thing. The matching term at the other end of the range is the ULoQ, the upper limit of quantitation. The ULoQ is the top of the interval over which the method measures to the stated quality — the upper bound of the analytical measuring interval.
The ordering is fixed by what each one asks: LoB < LoD ≤ LoQ. The LoB is the ceiling on blank noise. The LoD is the floor for reliable detection above that noise. The LoQ is the floor for reliable measurement that meets a stated precision or total-error goal.
Keeping them straight matters in practice. A claim of “detects down to X” is an LoD claim. “Measures accurately down to X” is an LoQ claim. Quoting the smaller LoD where a customer needs the LoQ overstates what the assay can actually do.
A result printed as < LoQ, or “below the limit of quantitation”, means the analyte may well be present, and the method may even have detected it. At that level, though, the method cannot put a reliable number on how much. Reporting the raw figure would imply a precision the measurement does not have, so the laboratory reports the limit instead. A result below the LoB, by contrast, cannot be distinguished from a blank at all, and is reported as not detected.
The right method depends on what your assay returns. An assay giving a number supports the classical standard-deviation approach. One giving a detected / not-detected call across a dilution series — a real-time PCR or another molecular assay, typically — gives you a hit rate instead. The detection limit is then the concentration detected 95% of the time. EP17-A2 is the reference protocol in both cases.
| Situation | Approach |
|---|---|
| Blank and low-level replicates, roughly normally distributed | Parametric (classical EP17): LoB from blank SD, LoD from pooled low-sample SD |
| Blank readings skewed or non-normal | Non-parametric: 95th percentile of the blank measurements |
| A dilution series with detected / not-detected outcomes, as in PCR, other molecular assays and qualitative tests | Probit regression: the concentration detected 95% of the time |
| You have precision measured across several concentrations | Precision-profile variance function: the LoD where LoB + 1.645 × the fitted SD reaches the concentration itself; the LoQ where the fitted CV or total error meets the goal |
The precision-profile route is especially useful, because it ties detection capability back to precision work you have probably already done.
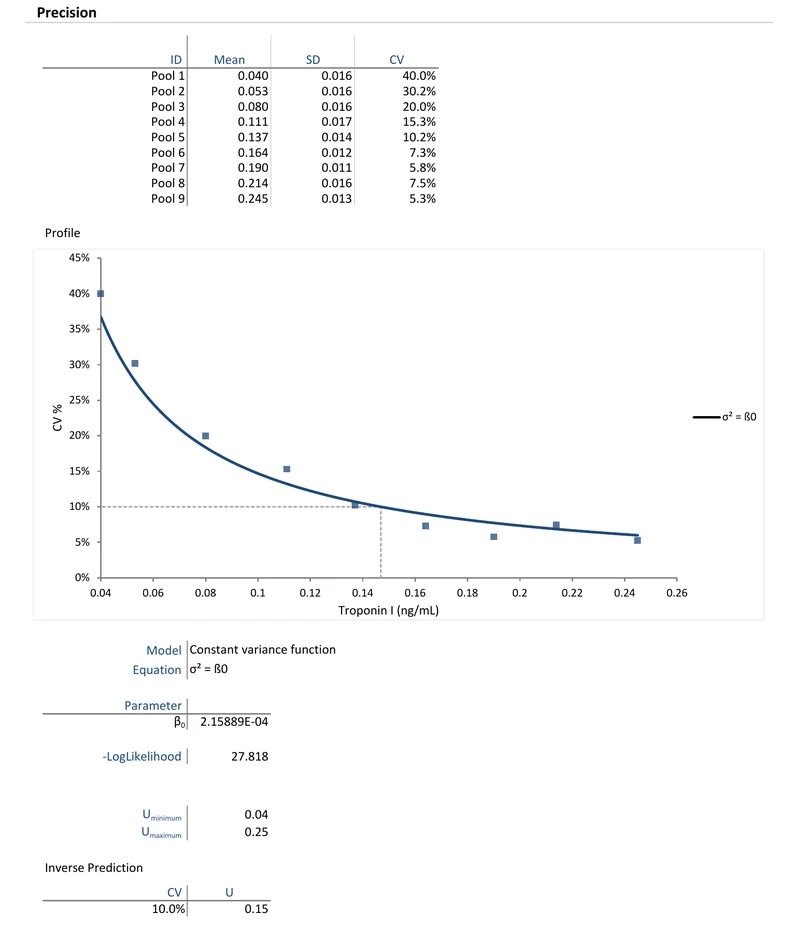
Near the bottom of a measuring range, imprecision is rarely constant. The standard deviation may stay roughly flat while the coefficient of variation climbs steeply as the concentration falls. The same absolute scatter simply becomes a larger fraction of an ever-smaller result. That rising CV is what makes low concentrations hard to quantify, and the LoQ marks the point at which it becomes too large.
So measure precision at several concentrations spanning the low end, with many replicates at each. Then fit a variance function describing how the standard deviation or CV changes with concentration. The function may be constant, proportional, a mix of the two or a power model with more parameters. The range of forms lets the function follow the real shape of the imprecision. What you get is a continuous curve of precision against concentration instead of a handful of isolated estimates.
The LoQ then follows directly as the concentration at which the fitted CV, or total error, crosses your goal. The goal can be a maximum CV of 20%, say, or an allowable total error. If that concentration falls below the LoD, the LoQ is taken as the LoD. No separate LoQ experiment is needed. The answer is also more stable than reading a single level, because it draws on every concentration measured rather than resting on one. Set a different goal and you read a different LoQ off the same curve, which is expected: the LoQ was always relative to the goal.
The profile is the same object a full precision-establishment study produces across the measuring range. The LoQ is then a by-product rather than a fresh study if you have characterised precision that way already. Detection capability and precision are therefore best treated as one connected piece of work.
Four worked examples, each ready to open in the Analyse-it trial:
The example workbook is downloading.
It opens in Excel on its own — the data and the finished results are both in it. Analyse-it is what lets you change the analysis and re-run it, try the same study on your own data, or work through it to see how the software handles it.
Every feature from all five editions for 15 days.
Reporting a number below the LoQ. A figure the method cannot quantify reliably belongs in the record as below the limit, not at face value. Printing the raw number claims a precision the measurement does not have.
Estimating an LoQ without stating the goal. The LoQ is the concentration meeting a precision or total-error target. Without that target it means nothing, so always state it: “LoQ = X at CV ≤ 20%”, not “LoQ = X”.
Reporting the LoB as the detection limit. The LoB is about blank noise, not detection. The LoB is always the smallest of the three, so quoting it as an LoD makes the assay look better than it is and misleads the reader.
Conflating LoD and LoQ. Detecting presence and quantifying to a stated precision are different claims with different thresholds. An assay can detect an analyte at a concentration where it cannot yet measure it reliably. Report both, and be clear which is which.
Using “sensitivity” without qualification. The word means different things to different readers, and in diagnostics it also means the true-positive rate, which is unrelated. Name the specific limit (LoB, LoD or LoQ) rather than leaving it to interpretation.
Assuming normality for skewed blank data. The parametric multiplier assumes the blank readings are roughly Gaussian. When they are not, the non-parametric percentile is the safer estimate for the LoB.
Analyse-it estimates all three limits under EP17-A2, on your own data, inside Excel:
Every feature from all five editions for 15 days. Detection capability is in the Method Validation and Ultimate editions, from US$ 475 a year. Probit regression, part of Fit Model, is in every edition. Validated against NIST and CLSI reference datasets. Full detail in the detection capability reference guide, and see how the LoQ anchors the analytical measuring interval.