
Sensitivity and specificity look like they can be computed from any 2×2 table comparing a new test to an existing one. They cannot, at least not correctly. Both are defined against truth: the true disease status of each subject. If the thing you compared your new test against is not a true reference standard but only another imperfect test, you have not measured sensitivity at all. You have measured agreement. The correct terms are positive and negative percent agreement.
Sensitivity is the proportion of truly diseased subjects the test flags. To compute it you need to know, independently, who is truly diseased. That means a reference standard: biopsy, culture, long-term follow-up, an established definitive method. Often no such standard is available. The reference method may be too invasive to use on every subject, or it may be imperfect itself. So a new assay gets compared against the best existing test instead.
The moment your comparator is another fallible test rather than the truth, the denominators change meaning. “Of everyone the comparator called positive, how many did the new test also call positive?” is not sensitivity. The comparator’s positives are not the truly diseased. Calling it sensitivity credits the new test with detecting disease when all you have shown is that it agrees with another test that is itself sometimes wrong. Evaluating a qualitative assay end to end covers where this sits in the wider study.
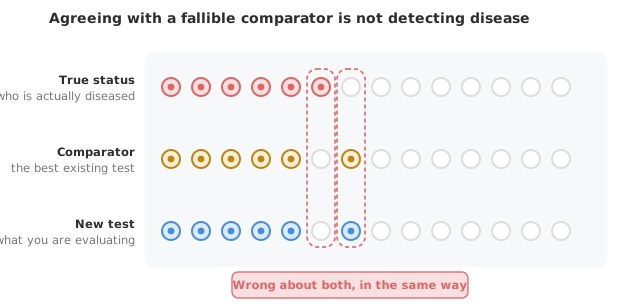
The correct statistics for this situation are positive percent agreement (PPA) and negative percent agreement (NPA).
PPA = (both tests positive) / (all comparator positives)
NPA = (both tests negative) / (all comparator negatives)
Arithmetically, PPA and NPA are computed exactly like sensitivity and specificity, from the same cells. The different name is a deliberate signal. The denominator comes from a comparator method, not a reference standard, and no claim about detecting true disease is being made.
The distinction is not pedantry. The US Food and Drug Administration (FDA) is explicit in its 2007 Statistical Guidance on Reporting Results from Studies Evaluating Diagnostic Tests. When the comparator is not a reference standard, results should be reported as percent agreement rather than sensitivity and specificity. Readers are then not misled into treating an agreement study as proof of accuracy. Performance studies for an IVD 510(k) sets out the rest of what that guidance recommends.
Two tests can agree beautifully and both be wrong in the same way. High PPA and NPA tell you the new test behaves like the comparator, which is useful if the comparator is trusted and you are seeking equivalence. High agreement says nothing about whether either test is actually right. Reporting that as “98% sensitivity” makes a claim about disease detection the study never supported. In a regulatory submission it is the kind of overstatement a reviewer will challenge.
The wording also changes how a reader should act. Sensitivity permits statements about ruling disease out. Percent agreement permits statements about interchangeability with the comparator. Those are different clinical claims, and the words carry the difference.
| Your comparator is… | Report… |
|---|---|
| A true reference standard (biopsy, culture, definitive method, confirmed status) | Sensitivity and specificity |
| Another imperfect test or predicate method (no independent truth) | Positive and negative percent agreement |
The rule is simple. Ask whether your comparator establishes the truth or only represents current practice. If the comparator is the best available method for establishing the condition, it is a reference standard. If it is only another test in current use, you are measuring agreement, and PPA and NPA are what you report.
Each agreement measure is a proportion, and each needs a confidence interval. The Wilson score interval is the sound default, especially with the small positive counts common in early evaluations. When you compare two new methods’ agreement with the same comparator, the Newcombe interval handles the difference between the two proportions properly. As always, a bare percentage without its interval hides how much the sample could be misleading you.
Download the CLSI EP12-A2 method comparison example workbook (.xlsx) — two qualitative methods for the same analyte compared, with positive and negative percent agreement and Wilson confidence intervals, ready to open in the Analyse-it trial.
The example workbook is downloading.
It opens in Excel on its own — the data and the finished results are both in it. Analyse-it is what lets you change the analysis and re-run it, try the same study on your own data, or work through it to see how the software handles it.
Every feature from all five editions for 15 days.
Reporting sensitivity when you mean PPA. If the denominator is a comparator method rather than confirmed truth, the number is percent agreement. Naming it sensitivity claims something the study cannot support.
Reading high agreement as proof of accuracy. Two tests can agree and both be wrong. Agreement shows equivalence to the comparator, not correctness.
Resolving discordants selectively. Re-testing only the cases where the two disagree, with a third method, and then including those results, biases the estimate upward. A pre-specified rule does not remove that bias. Report the unresolved figures as the result, and label any resolved figures as secondary.
Dropping the confidence interval. Early agreement studies often have few positives. The interval on PPA can be wide. Report it.
Analyse-it evaluates qualitative tests per EP12-A2, and the wording follows the comparator, inside Excel:
Every feature from all five editions for 15 days. Qualitative test evaluation is in the Medical, Method Validation and Ultimate editions, from US$ 340 a year. Validated against NIST and CLSI reference datasets. See the sensitivity and specificity guide for the reference-standard case; overall percent agreement counts raw concordance, while Cohen’s kappa corrects it for chance.