
A 510(k) is a comparison argument. Rather than demonstrating safety and effectiveness from first principles, you show that the candidate device performs equivalently to a legally marketed predicate. The performance section is where that case is made.
For in vitro diagnostic (IVD) devices that evidence is dominated by analytical work. FDA’s Overview of IVD Regulation page says analytical studies using clinical samples are sufficient in the majority of cases, and that FDA rarely requires prospective clinical studies. For a great many submissions the evidence is a set of analytical studies plus a method comparison against the predicate on clinical samples, and nothing more.
Where a clinical performance claim is made, a further set of rules applies to how the results are reported. Those rules come later on this page.
No single checklist exists. The applicable studies depend on the analyte, the technology, and above all on whether the reported result is quantitative, semi-quantitative or qualitative. FDA publishes device-specific guidance for many assay types, and that guidance rather than a generic list is the place to start.
The parameters commonly addressed in IVD submissions are set out below, each mapped to the protocol behind it from the Clinical and Laboratory Standards Institute (CLSI).
| Study | What it establishes | Protocol |
|---|---|---|
| Precision | Repeatability and within-laboratory precision, and reproducibility across sites, operators, instruments and reagent lots | EP05-A3 |
| Method comparison | Agreement with the predicate on clinical samples, and the bias at medical decision points | EP09-A3 |
| Linearity and measuring interval | The range over which the response stays linear, and the reportable range (quantitative assays) | EP06-Ed2 |
| Detection capability | Limit of blank, limit of detection and limit of quantitation | EP17-A2 |
| Analytical specificity | Interference from endogenous substances and medications, and cross-reactivity with related analytes | EP07-Ed3 |
| Reference interval | The expected values reported alongside a result | EP28-A3c |
| Total analytical error | Bias and imprecision combined, judged against an allowable limit | EP21-A |
| Cut-off and qualitative performance | The threshold, the grey zone around it, and agreement at the cut-off (qualitative assays) | EP12-A2, EP24-A2 |
Other studies belong in the same package but fall outside the protocols mapped here. The other studies are reagent and sample stability, carryover, traceability of calibrators to a reference material and matrix comparison across the claimed specimen types. For some immunoassays the high-dose hook effect belongs in the package too. Which CLSI EP protocol do you need maps the statistical set by the question each answers.
For a quantitative assay the centre of the submission is the method comparison against the predicate. What matters is not a correlation coefficient but the bias at the concentrations where clinical decisions are made. The bias is reported with a confidence interval and judged against a limit set in advance.
The choice of regression determines whether that bias estimate is trustworthy. That choice follows from two properties of the data: how precision behaves across the range, and whether the bias is constant or proportional. Linearity and detection capability then bound the range over which the claim holds.
For a qualitative assay the comparison is of classifications rather than concentrations, and the statistics change accordingly. The analysis then rests on the 2×2 table, the behaviour of the assay in the grey zone around the cut-off and paired measures of accuracy or agreement. Where the underlying measurement is quantitative but the reported result is positive or negative, both sets apply. You characterise the measurement, then the classification it feeds.
Precision in a submission usually means more than a single-laboratory design. Reproducibility studies are expected to span the sources of variation the device will meet in use: several sites, multiple operators, more than one instrument and multiple reagent lots. Reviewers often ask about lot-to-lot variation in particular, because a study run on a single reagent lot cannot see it.
The analysis is the same nested variance decomposition as any precision study (see precision components), with the study factors added as further levels. Report each component rather than one pooled figure, since which source dominates is what you need to act on.
Every study above produces a number that has to be judged, and a submission is weakened when the criterion appears only after the data. Acceptance limits are commonly derived from the predicate’s established performance, from an allowable total error specification or from biological variation. Whichever you use, fix it in the protocol before the study runs and state the basis for it.
Where the submission does include a clinical performance claim, FDA’s guidance on reporting results from studies evaluating diagnostic tests sets out its current thinking. Two scope points first. The document is guidance rather than regulation, describing recommendations rather than requirements. And it addresses tests whose final result is qualitative, even where the underlying measurement is quantitative.
Everything in the guidance follows from one decision: what the candidate is compared against. A reference standard is the best available method for establishing whether the target condition is present. A reference standard divides the population into two groups, and does not take the candidate’s result into account. Where you have one, sensitivity and specificity mean what they say.
Where you do not, the same arithmetic on the same table gives positive and negative percent agreement instead. Predictive values and likelihood ratios then cannot be estimated at all, because no subject’s true status is known. PPA and NPA versus sensitivity and specificity works through why the distinction is more than a labelling preference.
The reporting recommendations are specific. Report the 2×2 table itself, not only the statistics derived from it. Report the measures in pairs, each with a two-sided 95% confidence interval, and give each as both a fraction and a percentage so the denominator is visible. Break results down by clinical site, testing site and relevant subgroups. Account for every subject planned, tested, analysed and omitted, and report ambiguous results separately rather than dropping them.
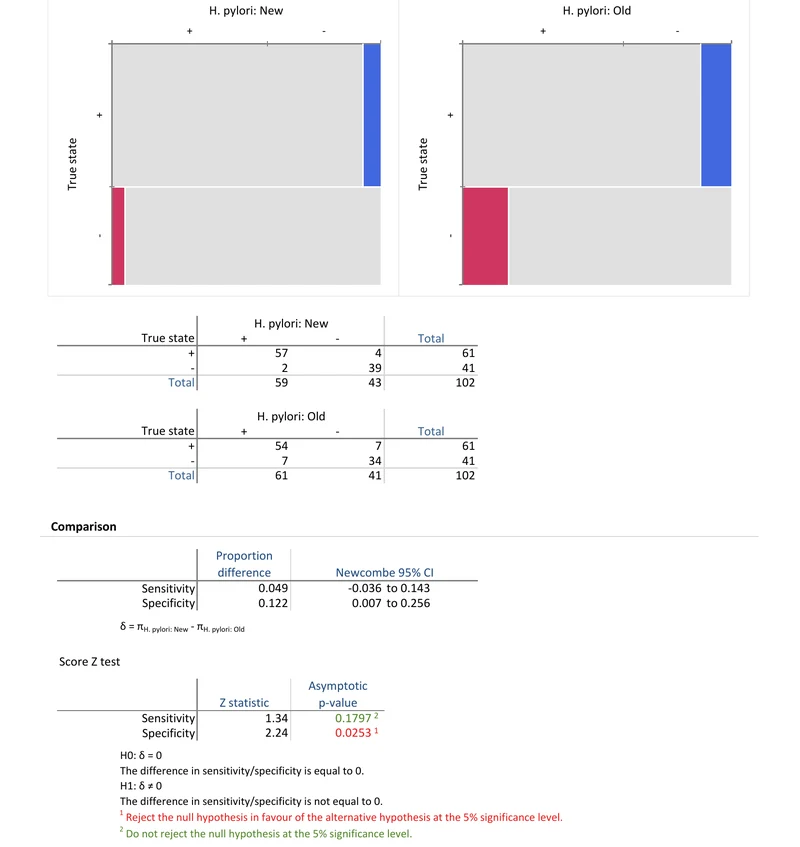
The most useful part of that guidance is the list of what not to do. Three of the four arise from a comparator that is not a reference standard.
Calling agreement sensitivity. Applying the terms sensitivity and specificity to a comparison against a non-reference standard.
Discarding equivocal results. If the device can return anything other than positive or negative under its own instructions, dropping those results biases the estimates. One option is to report two sets of measures, counting the equivocal results as positive in one and negative in the other.
Discrepant resolution. In this practice, every subject is tested with the candidate and the comparator. Where the two disagree, a third resolver test is run and the original table is revised accordingly. The guidance rejects the practice, because its reasoning fails twice.
Where the two agreed they are assumed correct and left alone, but two tests can agree and both be wrong. Where they disagreed, the comparator’s result is overwritten with the resolver’s. Results can therefore only move from disagreement towards agreement and never back, so the revised agreement can only rise or stay the same. The guidance notes that even a coin flip used as the resolver would raise it. Retesting the discordant subjects is not the error, and reporting those results separately is fine. Folding them back into the original table is.
Comparing against an algorithm that includes your own device. A comparator that is a sequence of methods must not use the candidate’s result to decide what happens next. A sequence that does will tend to agree with the candidate.
FDA discourages using overall percent agreement, or Cohen’s kappa, alone to characterise diagnostic performance, and demonstrates why with a pair of examples. Each example compares a candidate test with a non-reference standard in a 2×2 table of 572 subjects. Both candidates achieve overall agreement of 96.5%. The first has a positive percent agreement of 67.8% and a negative percent agreement of 99.8%. The second, 97.6% and 96.4%. One misses a third of the comparator’s positives and the other does not, and the single overall figure they share does not show it.
The same caution applies to kappa. Agreement measures also shift with prevalence. The guidance shows the same two methods, performing identically, returning a positive percent agreement of 90.9% in one population and 76.8% in another. The difference arises purely because the proportion with the condition changed. Report the pair, and the prevalence of the study population with it.
Performance estimates are properties of the study population as much as of the device. A study built from obviously affected and obviously healthy subjects, with the ambiguous middle left out, gives an optimistic result that will not hold in routine use. The distortion is spectrum bias, discussed in sensitivity, specificity and predictive values.
Subjects should span the range of disease states, include relevant confounding conditions and cover the intended demographic groups. The conditions of testing matter too: the final device used per the final instructions, multiple operators across a realistic range of expertise and several devices rather than one. For sizing, see sample size for a diagnostic accuracy study.
Download the CLSI EP09-A3 method comparison example workbook (.xlsx): the study at the centre of a quantitative submission. Its 79 samples are fitted by five regressions, each giving the predicted bias at a 5 µg/L decision point with a confidence interval, ready to open in the Analyse-it trial.
The example workbook is downloading.
It opens in Excel on its own — the data and the finished results are both in it. Analyse-it is what lets you change the analysis and re-run it, try the same study on your own data, or work through it to see how the software handles it.
Every feature from all five editions for 15 days.
Treating the clinical study as the submission. For most IVD 510(k)s there is no prospective clinical study. The analytical package and the comparison against the predicate make the case.
Quoting correlation for the predicate comparison. A correlation coefficient says nothing about bias at a decision point, which is the quantity the equivalence claim rests on.
Single-site precision. A one-laboratory study cannot see between-site variation. Between-operator and lot-to-lot variation are visible only if the study uses several operators and several reagent lots. A submission reporting only within-laboratory precision leaves these sources unanswered.
Reporting sensitivity against a predicate. A cleared predicate is another test, not the truth. Without a reference standard the measures are percent agreement.
Resolving discrepancies and revising the table. The reporting guidance lists this among its inappropriate practices. Report resolver results separately, and never fold them into the original table.
Setting acceptance criteria after the data. Every study needs its limit fixed in the protocol, with a stated basis.
Analyse-it performs the analytical studies against the CLSI protocols, inside Excel:
Every feature from all five editions for 15 days. The analytical set is in the Method Validation and Ultimate editions, from US$ 475 a year. Reference intervals and diagnostic performance are also in Medical, from US$ 340 a year. Validated against NIST and CLSI reference datasets. Start from which CLSI EP protocol do you need for the studies in order, or PPA and NPA versus sensitivity and specificity if the comparator question is unsettled. The studies mapped across the IVD product lifecycle sets out which apply at each stage.