
A qualitative test reports a category (positive or negative, reactive or non-reactive) rather than a number. Reporting a category does not make the test simpler to evaluate; the evaluation just takes a less familiar shape.
Accuracy still has to be measured, and so does precision. A binary result has no standard deviation, so the usual precision statistics do not apply. CLSI EP12, from the Clinical and Laboratory Standards Institute, sets out how to measure both. The precision part depends on one region: the concentrations near the cut-off, where the test switches from calling samples negative to calling them positive.
A note on editions before the detail. The current edition is EP12-Ed3, Evaluation of Qualitative, Binary Output Examination Performance, which replaced EP12-A2, User Protocol for Evaluation of Qualitative Test Performance. The change of title reflects a change of scope: the third edition covers evaluation by the manufacturer as well as by the user. CLSI also publishes a separate implementation guide, EP12IG, for the user verification case. The worked examples on this page are numbered from EP12-A2, but the statistics below are common to both editions.
Far above the cut-off, a decent qualitative test calls everything positive. Far below it, everything negative. Neither region tells you much about precision. All the interesting behaviour (the disagreements, the run-to-run inconsistency) lives in the transition zone straddling the cut-off. The precision part of an EP12 study concentrates replicate testing there, with enough spread on either side to map where the test flips. The accuracy part should use samples representative of the patients the test will see. A set loaded with obvious positives and negatives inflates agreement, and one loaded near the cut-off understates it.
How you express accuracy depends on what you compared against. The distinction matters enough to have its own guide. If you have a true reference standard (confirmed disease status, a definitive method), you report sensitivity and specificity. If your comparator is only another imperfect test, you cannot claim sensitivity. You report positive and negative percent agreement instead. Choosing the wrong pair of terms overstates what the study showed. Either way, report each figure with a Wilson confidence interval, because the numbers of positive and negative samples are often small.
A qualitative test’s precision is the width of its transition zone. Define the C5 concentration as the one at which the test calls samples positive 5% of the time. The C95 concentration is the one at which the test calls samples positive 95% of the time.
The interval between them, the C5–C95 interval, is the concentration range over which the result is genuinely uncertain. That interval is the qualitative analogue of imprecision. A narrow interval means the test flips crisply and reproducibly at its cut-off. A wide one means results are unreliable across a broad band of concentrations.
You estimate the interval by testing samples at several concentrations across the transition, many replicates each, and modelling the proportion positive against concentration. The width is worth comparing across reagent lots, instruments and operators.
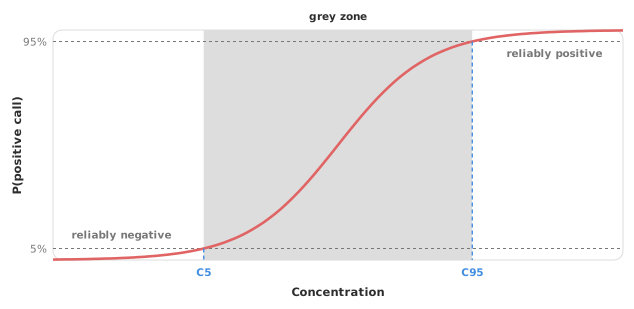
The transition zone is where a qualitative test is fragile, so it is where reproducibility should be checked. Does the C5–C95 interval hold across operators, instruments, reagent lots and sites? A test that flips crisply for one operator and sloppily for another has a reproducibility problem that a single-operator study would never reveal. For an assay heading into multi-site use, agreement of the transition zone across sites is as important as the reported sensitivity.
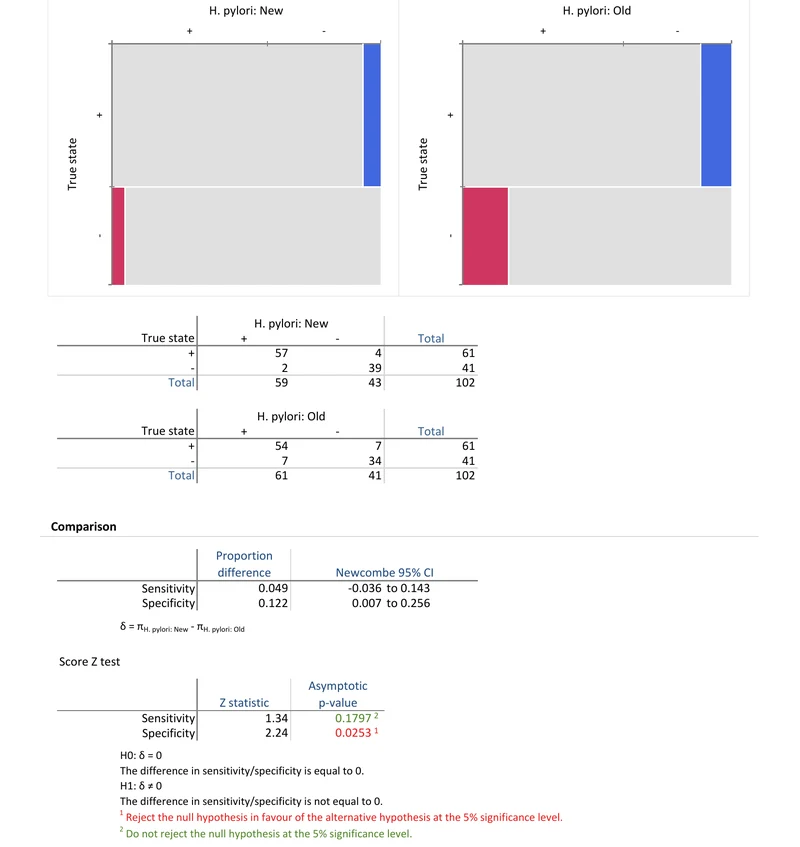
Download the CLSI EP12-A2 qualitative evaluation example workbook (.xlsx) — two H. pylori tests evaluated against a known true state, with Wilson intervals on sensitivity and specificity and Newcombe intervals on their difference, ready to open in the Analyse-it trial.
The example workbook is downloading.
It opens in Excel on its own — the data and the finished results are both in it. Analyse-it is what lets you change the analysis and re-run it, try the same study on your own data, or work through it to see how the software handles it.
Every feature from all five editions for 15 days.
Testing precision away from the cut-off. Replicates far from the cut-off always agree, and hide the transition zone where the test actually struggles. Put the precision samples near the cut-off, and the accuracy samples across the intended-use population.
Reporting sensitivity against a non-reference comparator. If the comparator is not a true standard, the figure is percent agreement, not sensitivity. Name it correctly.
Ignoring qualitative precision entirely. “It’s just positive or negative” is not a reason to skip precision. The C5–C95 interval is the precision, and near-cut-off results depend on it.
Dropping confidence intervals. Near-cut-off counts are small and the intervals are wide. A bare percentage overstates how well the test is pinned down.
Analyse-it runs the EP12-A2 evaluation on your own results, inside Excel:
Every feature from all five editions for 15 days. Qualitative test evaluation is in the Medical, Method Validation and Ultimate editions, from US$ 340 a year. Validated against NIST and CLSI reference datasets. See also sensitivity and specificity and Cohen’s kappa for agreement corrected for chance.