
An interferent is anything in the sample, other than the analyte itself, that changes the measured result. Interferents include endogenous substances such as haemoglobin, bilirubin and lipids, and exogenous ones such as drugs, metabolites and preservatives. The measurement still returns a value. The value is simply the wrong one, and nothing about the number announces that it is wrong. An interference study is how you find the effect before a patient result carries it into the record.
An interference study answers one question: how much does a given substance, at a given concentration, change the result? The design is deliberately narrow: hold everything constant except the suspected interferent, add it at a known concentration, and measure the change in result against a control. The control is an aliquot of the same sample given an equal volume of the solvent alone. The output is a bias: the difference the interferent produces at a given test concentration. CLSI EP07 is the reference protocol, and it separates two experiments.
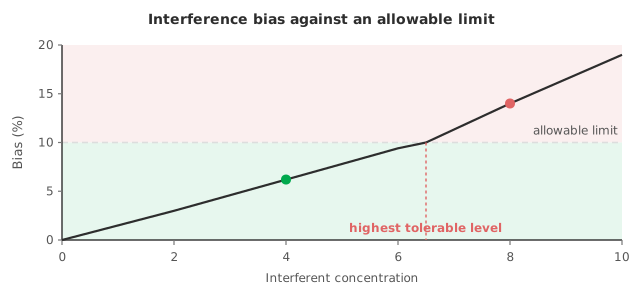
The interference screen is a paired-difference test at a high, clinically justified interferent level, giving a single yes/no on whether that substance matters at all. The dose-response study follows up on anything the screen flags. The interferent is added at several levels to characterise how the bias grows with concentration, and to find the level at which the bias first becomes unacceptable.
A bias figure on its own decides nothing. The interference matters only when it is large enough to change a clinical decision. The effect is tested against an allowable limit, usually derived from the same allowable total error or allowable bias you use elsewhere in validation. Below the limit, the interferent is present but harmless at that level. Above it, you have a claim to make on the label, a concentration to flag or a sample type to reject.
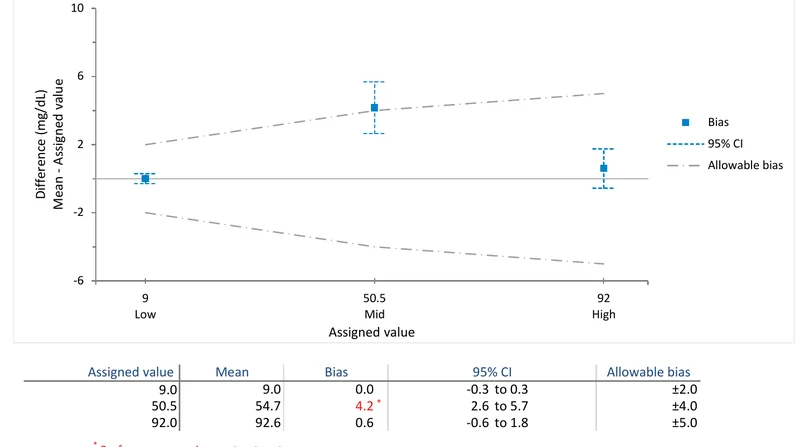
The decision is the same one made for bias anywhere in validation: the observed effect, with its confidence interval, set against the allowable limit.
An interference study asks “does adding this substance change the result?” A recovery study asks “if a known amount of analyte is added, does the method measure all of it?” Spike a sample with a known quantity and measure it alongside the unspiked sample. The recovery is the measured increase expressed as a percentage of the amount added. Recovery near 100% suggests the matrix is not suppressing or inflating the signal. Recovery away from 100% points to a proportional bias caused by the sample matrix rather than by a named interferent. The arithmetic differs but the judgement is identical: the recovery, or its shortfall, is tested against an allowable limit.
Report the effect as a bias with a confidence interval, at the interferent concentration tested, against the stated allowable limit. Do not report a bare “no interference”. “Interference from haemoglobin within ±5% up to 5 g/L” is a claim a reviewer can check. “No interference” is not. Where a dose-response was run, report the highest interferent level at which the bias stays inside the allowable band. That level is what a laboratory needs in order to set a rejection threshold.
Download the CLSI EP10-A3 example workbook (.xlsx) — a preliminary evaluation judging bias at three concentrations against allowable-bias limits, ready to open in the Analyse-it trial.
The example workbook is downloading.
It opens in Excel on its own — the data and the finished results are both in it. Analyse-it is what lets you change the analysis and re-run it, try the same study on your own data, or work through it to see how the software handles it.
Every feature from all five editions for 15 days.
Screening at an irrelevant concentration. An interference screen run at a level no real sample reaches proves nothing useful. Choose the high test level from clinical reality, such as the bilirubin concentration a jaundiced patient actually reaches, not a round number.
Reading a bias without an allowable limit. A +6% shift is neither pass nor fail until it is set against the assay’s error budget. State the allowable difference and test against it.
Treating a screen result as a dose-response. A single high-level yes/no cannot tell you the concentration at which interference sets in. If the screen flags an effect, characterise it.
Confusing recovery with linearity. Recovery probes the matrix at a point. Linearity probes the relationship across the interval. They answer different questions and neither substitutes for the other.
Analyse-it judges bias against your allowable limit, inside Excel:
Every feature from all five editions for 15 days. Bias against allowable limits is in the Method Validation and Ultimate editions, from US$ 475 a year. Analyse-it has no dedicated interference-testing (EP07) task. Validated against NIST and CLSI reference datasets. See verifying manufacturer precision claims for the related trueness question.