
A likelihood ratio (LR) is the probability of a given test result in people with the disease divided by its probability in people without it.
Sensitivity and specificity do not depend on prevalence. Provided the case mix is similar, a figure measured in one population applies in another. But both answer a question the clinician does not have, because they start from a known disease status and give the probability of the result.
In the clinic the result is already known, and it is the disease status that has to be worked out. Predictive values answer that question, but they depend heavily on prevalence. A positive predictive value measured in one population can mislead in another where the prevalence differs.
The likelihood ratio answers the clinician’s question and does not depend on prevalence.
The positive likelihood ratio (LR+) is sensitivity divided by (1 − specificity): how much more often a positive result arises in a diseased than a non-diseased person. The negative likelihood ratio (LR−) is (1 − sensitivity) divided by specificity: the same comparison for a negative result.
A test with 90% sensitivity and 94% specificity has LR+ = 0.90 / 0.06 = 15 and LR− = 0.10 / 0.94 = 0.11.
What makes likelihood ratios worth the extra step is a single rule: post-test odds = pre-test odds × likelihood ratio. The rule works in odds rather than in probability, so you convert probability to odds first and odds back to probability afterwards.
Odds are the probability divided by one minus the probability. A probability is recovered from odds as the odds divided by one plus the odds. Take a patient whose history and presentation put their pre-test probability at 20%. As odds that is 0.20 / 0.80 = 0.25. A positive result on the test above multiplies by 15: post-test odds 0.25 × 15 = 3.75, which converts back as 3.75 / (1 + 3.75) ≈ 79%.
The same test applied to a patient with a 5% pre-test probability gives a post-test probability near 44%. Same test, same likelihood ratio, different patient. The ratio handled the difference without anyone quoting a population prevalence that may not fit either patient.
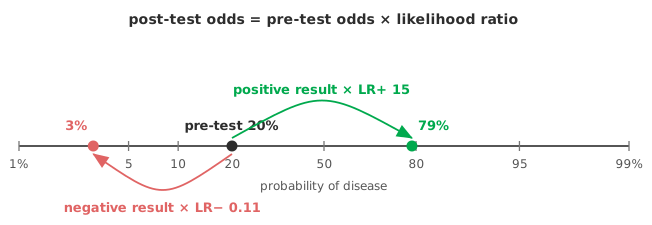
As a rough guide, an LR+ above 10 or an LR− below 0.1 produces a large and often conclusive change in probability (Jaeschke, Guyatt and Sackett 1994). Ratios between about 0.5 and 2 barely shift the probability and rarely change a decision.
These are guides, not thresholds. The same likelihood ratio moves a patient a long way in absolute terms when the pre-test probability is near 50%, and much less when it is near 1%. An LR+ of 15 takes 50% to 94% but 1% only to 13%. The ratio must therefore be applied to each patient’s own pre-test odds.
Both answer the clinician’s question, and the difference is where the prevalence goes.
A positive predictive value is the probability of disease given a positive result, in the population the study was done in. The prevalence of that population is already inside the number. The built-in prevalence makes a PPV easy to quote and easy to misuse. Carry a PPV of 79% from a specialist clinic into a screening programme and it will be badly wrong, because the prevalence changed and the number did not.
A positive likelihood ratio holds no prevalence at all. It says only how much more often a positive result arises in disease than out of it. The prevalence is supplied separately, by the individual patient’s pre-test probability, at the moment the ratio is applied.
The two are the same calculation stopped at different points. Applying LR+ = 15 to a pre-test probability of 20% gave a post-test probability of 79% above. The figure of 79% is exactly the positive predictive value the test would show in a population with 20% prevalence. A predictive value is a likelihood ratio that has already been applied to one particular prevalence and had the answer written down.
| Predictive value | Likelihood ratio | |
|---|---|---|
| Answers | Probability of disease given this result | How much this result changes the probability |
| Depends on prevalence | Yes, and the prevalence is hidden inside it | No |
| Transfers to another population | Only if the prevalence matches | Yes, if the case mix is similar |
| Applies to one patient | Only through the study population’s prevalence | Yes, through that patient’s pre-test probability |
| Effort at the bedside | None, read it off | Convert to odds, multiply, convert back |
The same applies to the negative pair. A negative predictive value is fixed to its study population; the negative likelihood ratio travels, and reaches a probability only once a pre-test probability is supplied. Report both if you like, but quote the predictive value with the prevalence it was measured at, or it will be read as though it applied everywhere. Sensitivity, specificity and predictive values covers the predictive values in full.
Divide LR+ by LR− and you get the diagnostic odds ratio, a single summary of how well the test separates disease from non-disease. The diagnostic odds ratio is convenient for comparing tests, though it discards the rule-in versus rule-out detail that makes the two ratios individually useful.
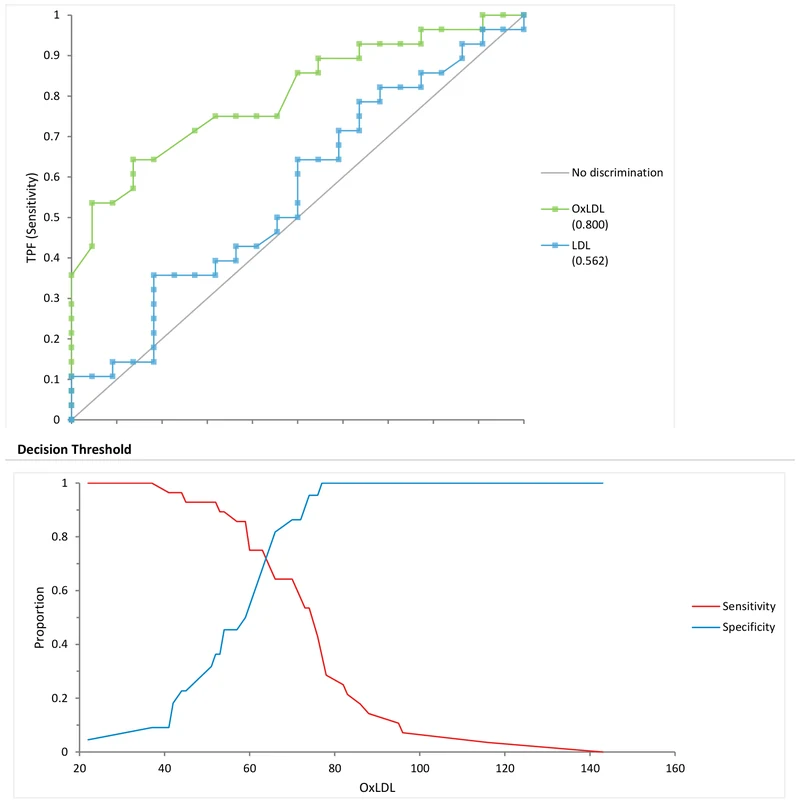
Likelihood ratios also connect straight to the ROC curve: the slope of the curve at any point is the likelihood ratio of a result at that threshold. A steep stretch of the curve marks results that point strongly towards disease, and a flat stretch marks results that point strongly away from it.
Report both ratios with confidence intervals. The interval on LR+ widens sharply when the non-diseased group is small or specificity approaches 100%. A perfect specificity puts a zero in the denominator and sends LR+ to infinity. An infinite LR+ is a reason to report the interval and, often, to enlarge the non-diseased group.
Quote likelihood ratios in preference to a predictive value whenever your study prevalence does not match the population the test will be used in.
Download the CLSI EP24-A2 example workbook (.xlsx): ROC curves for OxLDL and LDL with each AUC, and a decision threshold plot of sensitivity and specificity across OxLDL cut-offs, ready to open in the Analyse-it trial.
The example workbook is downloading.
It opens in Excel on its own — the data and the finished results are both in it. Analyse-it is what lets you change the analysis and re-run it, try the same study on your own data, or work through it to see how the software handles it.
Every feature from all five editions for 15 days.
Reasoning in probability instead of odds. The multiplication rule works on odds, not probabilities. Convert, multiply, convert back, or use a nomogram. Do not multiply a probability by a likelihood ratio.
Quoting an LR+ without its interval. A high LR+ from few non-diseased subjects is unstable and may rest on a single false positive. The confidence interval says how much to trust it.
Ignoring LR− when the test is used to rule out. A strong LR+ says nothing about ruling a diagnosis out. For that you need a small LR−, and the two are not interchangeable.
Reporting the diagnostic odds ratio alone. It compresses rule-in and rule-out into one number and hides which one the test is good at. Keep the two likelihood ratios visible.
Analyse-it reports the ratios alongside the rest of the measures, inside Excel:
Every feature from all five editions for 15 days. Diagnostic accuracy is in the Medical, Method Validation and Ultimate editions, from US$ 340 a year. Validated against NIST and CLSI reference datasets. See the ROC and AUC guide for discrimination across all cut-offs.