
A process capability index compares the spread of a process with the width of its specification. Cp, Cpk, Pp and Ppk are the four indices used in process capability analysis. All four answer versions of one question: will this process reliably produce output inside the limits? The four differ in whether they account for centring, and in whether they use the short-term or the long-term spread. Confusing them is how a process with an impressive index can still ship non-conforming units.
Cp, also called the process capability ratio (PCR), is the specification width divided by the process spread. The width is the band between the upper and lower specification limits (USL and LSL), and the spread is six standard deviations.
Cp = (USL − LSL) / 6σ
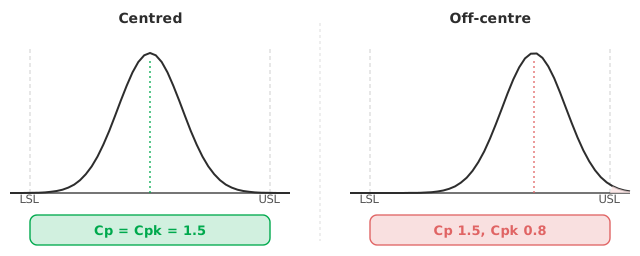
Cp measures potential: whether the process is narrow enough to fit inside the specification if it were perfectly centred. A Cp of 1.0 means the spread exactly fills the tolerance, and a Cp of 1.33 leaves a comfortable margin. Below 1.0 the process is simply too wide, wherever you put it. What Cp cannot see is where the process actually sits.
Cpk adds what Cp leaves out: the distance from the process mean to the nearer specification limit, in units of three standard deviations.
Cpk = min[ (USL − mean) / 3σ , (mean − LSL) / 3σ ]
When the process is perfectly centred, Cpk equals Cp. As the process shifts towards one limit, Cpk drops below Cp, even though the spread has not changed. The gap between them is exactly the penalty for being off-centre. A process can have Cp 2.0 and Cpk 0.8: more than narrow enough, but sitting so close to a limit that it fails anyway.
The arithmetic is simple. Take limits at 7 and 11 and a standard deviation of 0.5. A process centred at 9 has Cp = (11 − 7) / (6 × 0.5) = 1.33, and Cpk matches at 1.33. Let the mean drift to 10 with the spread unchanged and Cp stays 1.33. But Cpk = (11 − 10) / (3 × 0.5) = 0.67. The process is now failing on the upper side while its Cp still looks acceptable.
The Cp/Cpk pair uses the within-subgroup standard deviation: the short-term spread, estimated from variation inside rational subgroups, which represents the process at its best. The Pp/Ppk pair uses the overall standard deviation of all the data, which also captures the drifts and shifts that occur between subgroups over time.
Cp/Cpk describe capability: what the process could do if the between-subgroup variation were removed. Pp/Ppk describe performance: what it actually delivered. A large gap between the two pairs is itself a finding: the process is capable in principle but is not being held stable over time.
Cp, Cpk and their long-term counterparts all measure against the specification limits. None of them refers to the target. Cpm adds the target, penalising the process for sitting away from a nominal target value, not only for approaching a limit. Cpm is the index to report where hitting the target matters, not only staying inside the tolerance.
An index is a point estimate from a finite sample, so it carries a confidence interval. A Ppk of 1.30 with an interval reaching down to 1.05 is a different message from one holding above 1.25.
A capability index only means anything if the process was in control when the data were taken. Capability answers “does a stable process meet the specification?” Establish stability on a control chart first. An index computed on an out-of-control process describes nothing repeatable. The standard index also assumes the distribution is roughly normal. Where the data are skewed, see capability for non-normal data before reading the index at face value.
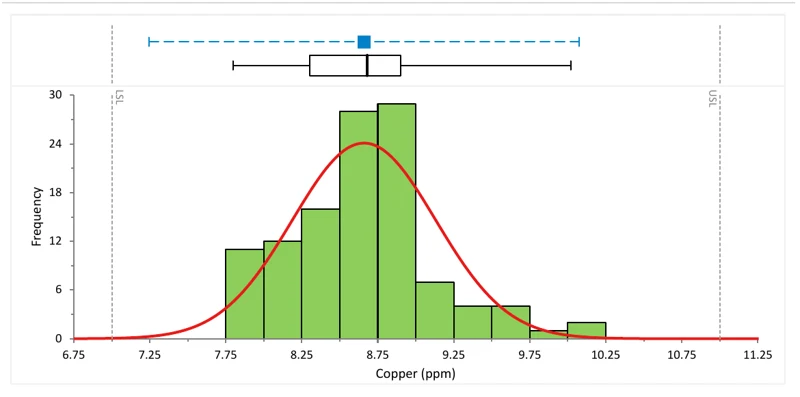
Download the process capability example (.xlsx) — copper plating with a stability check, histogram against specification limits, and Pp/Ppk indices with confidence intervals, ready to open in the Analyse-it trial.
The example workbook is downloading.
It opens in Excel on its own — the data and the finished results are both in it. Analyse-it is what lets you change the analysis and re-run it, try the same study on your own data, or work through it to see how the software handles it.
Every feature from all five editions for 15 days.
Quoting Cp alone. Cp ignores centring, so a high Cp can sit over a process that is failing on one side. Report Cpk beside it.
Confusing capability with performance. Cp/Cpk use short-term spread; Pp/Ppk use long-term. Comparing one study’s Cpk with another’s Ppk, or reporting only the more favourable one, misstates what the process actually delivers.
Computing capability on an unstable process. Without control first, the index estimates nothing repeatable. Confirm stability, then measure capability.
Dropping the confidence interval. A capability index from a small sample is uncertain. Report the interval, especially near a pass/fail threshold like 1.33.
Analyse-it reports the indices with their uncertainty, inside Excel:
Every feature from all five editions for 15 days. Capability analysis is in the Quality Control & Improvement and Ultimate editions, from US$ 290 a year. Validated against published reference datasets and thousands of internal test cases. See sigma level and PPM for turning capability into a defect rate, or the process capability reference guide.