
1. Tutorials
  2. Process capability tutorial

Process Capability in Excel: Cp, Cpk Worked ExampleLearn how to determine the ability of a process to meet specifications.

To illustrate the concepts, we will use data on the amount of copper in the plating of a product. The specifications from our customer require the copper content to be between 7 and 11 ppm.

In this tutorial you will perform the following tasks:

Determining process capability

To determine process capability it is important that the process is in statistical control. It is meaningless to characterize a process that is unpredictable.

  1. Open the file tutorials\Copper.xlsx.

    The worksheet is open and shows the data we used in the process control tutorial.

  2. On the worksheet, alongside the Phase column, click the drop-down arrow, then clear the IQ and Production check boxes, and select the OQ check-box, and click OK.

    The data is filtered to only the phase when the process was-in control is used.

  3. On the Analyse-it ribbon tab, in the Statistical Analyses group, click Capability, and then click 6-up.
    The analysis task pane opens.
  4. In the Process drop-down list, select Copper.
  5. In the Id drop-down list, select Date.
  6. In the LSL edit box, type 7.
  7. In the USL edit box, type 11.
  8. Select the Capability ratios and Nonconforming units check boxes.
  9. Click Calculate.
    The results are calculated and the analysis report opens.

The 6-up capability analysis shows the process control charts, a histogram of the distribution, a box-plot summary of the distribution, a mean +/- 3 sigma plot, and normal probability plot. Upper and lower specification limits show the specification.
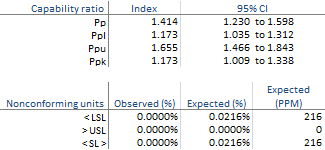
Process capability indices
Based on the report you can see:
  • The process is in statistical control during the period.
  • The distribution is approximately Normal which is an assumption of most capability indices.
  • Ppk is 1.173 indicating the process is not capable meeting the specifications.
  • Pp is 1.414 indicating that if the process were centered between the specification limits it would just be acceptable.
  • It is expected the process will produce 216 non-conforming units per million.

What's the difference between Pp and Cp?

Process performance / capability indices describe the ability of the process to meet the specifications. When a process is not capable of meeting specifications it is worth investigating the potential changes such as centering the process average or other ways of reducing variation.

  1. On the Analyse-it ribbon tab, in the Report group, click Clone.

    The dataset worksheet and analysis task pane are displayed.

  2. In the Sigma estimator drop-down list, select Short-term.
  3. Click Calculate.
    The results are calculated and the analysis report opens.

The Cp indices are larger than the Pp indices indicating there is some variation between the subgroups that could be eliminated from the process such as more frequent recalibration of the automated colorimeter to reduce the drift in the copper concentration. Reducing the variation between subgroups and centering the process would lead to a capability ratio Cp of 1.672. Or a reduction to just 16 non-conforming units per million.
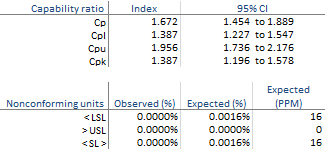
Process capability indices

Tutorials v6.24.0