
1. Tutorials
  2. Compare groups means tutorial

Comparing Two or More Groups in Excel: Worked ExampleLearn how to test for a difference between the means of 2 groups and estimate the size of the effect.

Twenty-one African-American men participated in an experiment to test whether increasing calcium intake reduces blood pressure. Ten of the men took a calcium supplement for 12 weeks while the remaining 11 men received a placebo. Researchers measured the blood pressure of each subject before and after the 12-week period. The experiment was double-blind.

In this tutorial you will perform the following tasks:

Testing for a difference of means

Probably the most common statistical analysis is a test for a difference in the means of two groups. The Student's t-test is the most popular test.

  1. Open the file tutorials\Effect of Calcium on Blood Pressure.xlsx.
  2. Click a cell in the dataset.
  3. On the Analyse-it ribbon tab, in the Statistical Analyses group, click Compare Groups drop-down, and then click Student t.
    The analysis task pane opens.
  4. In the Y (response) variable list, select Decrease.
  5. In the X (factor) variable list, select Treatment.
  6. In the Significance level edit box, enter 5%.
  7. Click Calculate.
    The results are calculated and the analysis report opens.

You can see the p-value of the hypothesis test is not significant at the 5% level. Therefore, do not reject the null hypothesis of no difference in the treatments.

student t-test

Testing assumptions of the t-test

Many statistical tests have assumptions that must be true for the test results to be valid. A pooled sample t-test assumes that the samples are normally distributed and the variances of the groups are equal. It can be useful to verify the assumptions.

Note: Although this tutorial formally tests the assumptions of the t test, many statisticians would recommend against doing so because the t-test is fairly robust to departures from normality for moderate sample sizes. Also some homogeneity of variance tests can be extremely sensitive to departures of normality and may cause you to believe the variances are not equal.
  1. On the Analyse-it ribbon tab, in the Compare Groups group, click Test Normality.

    A Shapiro-Wilk normality test is added to the analysis task pane.

  2. On the Analyse-it ribbon tab, in the Compare Groups group, click Test Homogeneity of Variance, and then click Levene.

    A Levene test for variances is added to the analysis task pane.

  3. In the Significance level edit box, enter 5%.
  4. Click Recalculate.
    The results are recalculated and the analysis report updates.

The p-value of the normality test is not significant so do not reject the null hypothesis. The data can be treated as normally distributed.
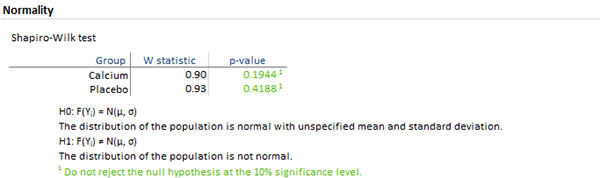
normality test

The p-value of the homogeneity of variance test is 0.04 so reject the null hypothesis of homogeneity of variances in favor of the alternative hypothesis of a difference in variances.

levene test

Trying a different statistical test

When you are unsure if the assumptions are met you can try a more robust statistical procedure. For example, the Welch t test is a test for a difference in mean that doesn't have the assumption of equality of variances like the Student t test.

  1. On the Analyse-it ribbon tab, in the Report group, click Clone.

    The dataset worksheet and analysis task pane are displayed.

  2. On the Distribution analysis task pane, in the Location panel, in the Test drop-down list, select Welch t test.
  3. Click Calculate.

    The results are calculated and a new analysis report is created.

Tutorials v6.20.0