
A method comparison needs a minimum of around 40 patient samples, the figure CLSI EP09-A3 suggests, spread across the measuring interval. Beyond that floor, the right number depends on how precisely you need to know the bias at each decision point. The tempting answer is a round number like 40 or 100, but a count alone misses what the samples are for. Samples exist to estimate the bias at the concentrations where decisions are made, tightly enough to trust, and that takes more than a headcount.
Forty samples clustered in the middle of the measuring interval are worth less than forty spread across it. The bias at a low decision point and at a high one can differ substantially. A regression can only pin down the relationship across a range it has actually seen. Extrapolating a fitted line beyond the data is guesswork.
The first requirement is spread: samples reaching both ends of the interval and distributed across it. Ideally, enough samples sit at and around each medical decision point to estimate the bias there precisely. A study can have plenty of samples and still be underpowered where it matters, if none of them sit near the decision level.
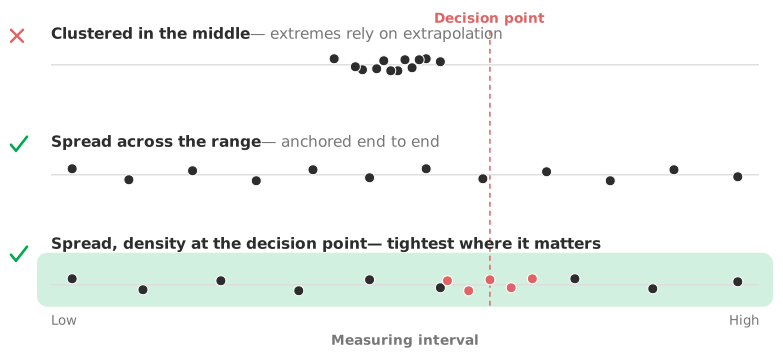
The right way to think about the count is backwards from the answer. The output is the bias at each decision point, with a confidence interval. How tight that interval needs to be is a clinical judgement. The interval must be narrow enough to place the bias confidently inside or outside the allowable limit.
A bias far from the allowable limit tolerates a wider interval, and so fewer samples. A bias sitting close to the allowable limit needs a tight interval, and therefore more. Size the study on the interval width you require, rather than on a habit or a minimum. Otherwise you can finish a comparison that cannot answer the question.
Measuring each sample in replicate on both methods reduces the contribution of measurement error to the comparison. The estimate of the true relationship sharpens without collecting more patients. Replication is not a substitute for range or count, though. Replicates of the same clustered samples still leave the extremes unexamined. Where samples are scarce, replication recovers some precision. The choice between more samples and more replicates depends on which is the binding constraint: patient availability, or the measurement noise of the assays.
Download the CLSI EP09-A3 method comparison example workbook (.xlsx) — 79 samples across the range with the bias at a decision point and its confidence interval, ready to open in the Analyse-it trial.
The example workbook is downloading.
It opens in Excel on its own — the data and the finished results are both in it. Analyse-it is what lets you change the analysis and re-run it, try the same study on your own data, or work through it to see how the software handles it.
Every feature from all five editions for 15 days.
Treating the minimum as the target. Forty is a floor, not a goal. Size the study on the precision your decision needs, which is often more.
Collecting count without range. Samples clustered in the middle cannot estimate bias at the extremes. Spread them across the interval and around the decision points.
Ignoring the decision points when sampling. The bias that matters is at the decision level. Make sure samples sit there, not just somewhere on the range.
Finishing before checking the interval width. A completed study with a decision-point bias interval too wide to act on has not answered the question. Judge sufficiency by the interval, not the count.
Plan the study so the interval lands where you need it; Analyse-it then shows whether it did, inside Excel:
Every feature from all five editions for 15 days. The full method comparison analysis, including the regression fits, is in the Method Validation and Ultimate editions, from US$ 475 a year. The Medical edition, from US$ 340 a year, covers Bland–Altman agreement but not bias at decision points. Validated against NIST and CLSI reference datasets. See bias at a decision point, or how many samples for a diagnostic accuracy study for the qualitative counterpart.